
Bitcoin's Bull Run: Can $160K Be Next? Decoding the On-Chain Signals
Bitcoin has been on a steady climb this year, but skeptics are asking: Is the $160K target realistic, or are we nearing a peak? Let's dive into CryptoQuant's on-chain data and historical cycles to find answers.
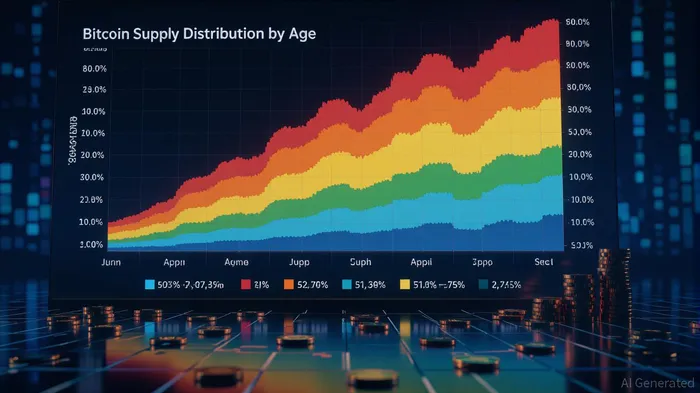
The Scarcity Engine: Why Bitcoin's Supply is Tightening
The April 2024 halving slashed new Bitcoin issuance to just 900 BTC per day, creating a “supply shock” that's tightening the market. Here's the math:
- 74% of all Bitcoin (14.6 million of 19.8 million total) haven't moved in over two years.
- 75% of the supply has been dormant for at least six months, locking up liquidity.
This isn't just hoarding—it's a HODL wave of historic proportions. With fewer coins available to meet demand, even modest buying pressure could send prices soaring.
Technical Indicators: The NVT Golden Cross and More
The Network Value to Transactions (NVT) ratio is a critical gauge of Bitcoin's valuation relative to real-world use.
- A golden cross (when the short-term moving average crosses above the long-term average) signals undervaluation. The current NVT of 1.51 is far below the 2.2 “bubble” threshold, meaning Bitcoin is still grounded in utility, not speculation.
Holder Behavior: Profit-Taking or Long-Term Conviction?
- Realized Capitalization: Surged past $900 billion, marking a new all-time high. This means long-term holders have locked in gains, but aren't selling.
- SOPR (Spent Output Profit Ratio): At 1.03, coins are being moved at or just above breakeven.
- MVRV (Market Value to Realized Value): A 2.3× multiple shows long-term holders are up 230%, but short-term traders only 13%.
This isn't a “panic sell”—it's a healthy correction. Institutional holders are buying dips, not fleeing.
Institutional Inflows: The ETF Fuel
Bitcoin's rise isn't just about code—it's about capital flows.
- Bitcoin spot ETFs now hold $131 billion in assets, with BlackRock's IBIT leading at $4.8 billion.
- Standard Chartered and Bernstein forecast $200K by year-end, citing Bitcoin's “digital gold” narrative and ETF-driven demand.
Even Michael Saylor (yes, the guy who bought Bitcoin at $500) is bullish, arguing that $160K is a conservative target given halving scarcity.
Cycle Timing: When Does the Bull End?
Bitcoin's four-year cycle suggests we're in the third year of a bull run (post-2021 lows). Historically, this phase sees 120%+ gains.
- The last post-halving cycle (2020–2021) peaked 14 months after the halving. At this rate, Q4 2025 could be the climax.
Red Flags: Don't Get Overconfident
- Macro Risks: A recession or Fed rate hike could spook markets. Bitcoin's correlation with equities isn't dead yet.
- Overvaluation Risks: The S2F model has overstated prices since 2021. Stick to on-chain signals, not just theory.
- Derivatives Overhang: Excessive futures trading could amplify volatility if traders panic.
Action Items for Investors
- Accumulate on Dips: Use pullbacks to $95K–$100K as buying opportunities.
- Monitor NVT and MVRV: A rising NVT or MVRV Z-Score over 3 could signal overextension.
- Avoid Leverage: Stick to spot purchases or long-dated options to avoid rollover costs.
Final Take
The data is clear: Bitcoin's supply squeeze, institutional inflows, and historical cycle timing all point toward a $150K–$200K finish in 2025. But remember—cycles end when greed turns to fear. Stay disciplined, and let the on-chain signals guide you.
Final Word: The path to $160K is paved with data, not hype. Ride the wave, but keep one eye on the horizon.
Delivering real-time insights and analysis on emerging financial trends and market movements.
Latest Articles
Stay ahead of the market.
Get curated U.S. market news, insights and key dates delivered to your inbox.


Comments
No comments yet