
Bitcoin at the Bearish Threshold: Strategic Entry Points Amid Volatility


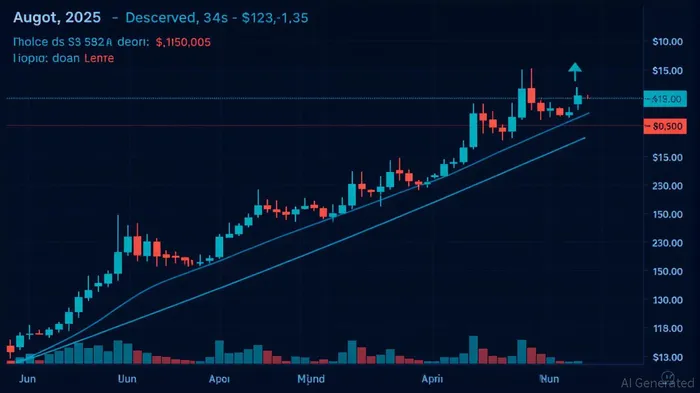
Bitcoin's price action in late August 2025 has created a pivotal moment for contrarian investors. After reaching an all-time high of $124,200 on August 14, the cryptocurrency has entered a correction phase, testing critical support levels near $111,464. This pullback has positioned BitcoinBTC-- at a bearish threshold, where technical and on-chain signals suggest both risk and opportunity. For investors willing to navigate the volatility, the current market structure offers a roadmap for strategic entry points.
Technical Indicators: A Bearish but Not Hopeless Picture
Bitcoin's short-term technical indicators paint a bearish narrative. The price has broken below the $120,000 zone and is stabilizing near the $110,000 support level, a key psychological threshold. The 14-day RSI (Relative Strength Index) stands at 47.414, below the 50 neutral threshold, confirming weakening bullish momentum. On the 4-hour chart, Bitcoin is trading within a steep descending channel, with lower highs and lower lows since its all-time high. A breakdown below $110,000 could target the $104,000 fair value gapGAP-- or retest the $100,000 level.
However, mixed signals emerge from longer-term indicators. The 50-day and 200-day moving averages show a bearish bias, but the 100-day MA at $107,116.32 and 200-day MA at $100,391.82 suggest a strong reversal in the medium to long-term trend. The MACD (Moving Average Convergence Divergence) at 0.015 provides a rare buy signal, hinting at potential short-term stabilization.
On-Chain Metrics: Contrarian Signals in a Bearish Climate
On-chain data adds nuance to the bearish narrative. The Network Value to Transactions (NVT) ratio for Bitcoin is currently at 1.51, well below the overvaluation threshold of 2.2. This suggests that the market capitalization is supported by meaningful on-chain activity, not speculative frenzy. A rare “golden-cross” in the NVT ratio—a bullish alignment of valuation and usage—further reinforces the idea that Bitcoin's price correction is part of a broader consolidation phase rather than a sign of distress.
The MVRV (Market Value to Realized Value) ratio for long-term holders (LTH-MVRV) also provides insight. While the broader MVRV ratio is in a bearish range, the LTH-MVRV remains relatively stable, indicating that long-term investors have not capitulated. This suggests that institutional and high-net-worth participants are accumulating at current levels, potentially setting the stage for a rebound.
Funding rates for Bitcoin futures on exchanges like Bybit and OKX have turned negative, signaling bearish sentiment in the derivatives market. However, extreme negative funding rates have historically preceded major price bottoms, as seen in 2019 and 2020. This creates a contrarian opportunity for investors who can stomach short-term volatility.
Strategic Entry Points: Dollar-Cost Averaging and High-Conviction Bets
For investors seeking to capitalize on the current bearish threshold, a disciplined approach is essential. Dollar-cost averaging (DCA) into the $111,900–$113,800 range is advisable, as on-chain data indicates strong institutional buying in this zone. A high-conviction entry at the $100,000–$105,000 floor aligns with historical support levels and offers a margin of safety.
Options-based hedging is another attractive strategy given Bitcoin's low volatility (~32%). Out-of-the-money calls costing ~6% of spot value can protect against downside risk while allowing for upside potential. For those with a longer-term horizon, accumulating Bitcoin below $100,000 could position investors for a retest of the $124,500 all-time high, particularly if macroeconomic catalysts like a dovish Federal Reserve policy trigger a risk-on rally.
Exit Strategies and Risk Management
A rebound above $113,500 validates a bullish flag pattern, while a close above $112,000 could trigger a retest of $124,500. Trailing stop-loss orders and Fibonacci retracement levels (particularly the 61.8% level) provide dynamic profit-taking targets. A breakdown below $106,000, however, would signal increased bearish sentiment, warranting a reassessment of risk exposure.
Conclusion: Navigating the Bearish Threshold with Discipline
Bitcoin's current price action reflects a maturing bull cycle, supported by institutional adoption, regulatory clarity, and on-chain strength. While the bearish threshold poses risks, it also offers strategic entry points for contrarian investors. By focusing on key support/resistance levels, leveraging on-chain metrics like NVT and MVRV, and aligning strategies with macroeconomic catalysts, investors can navigate the volatility with confidence.
As the market digests the correction, patience and discipline will be key. For those who can stomach the short-term pain, the long-term reward may be substantial.
Decoding blockchain innovations and market trends with clarity and precision.
Latest Articles
Stay ahead of the market.
Get curated U.S. market news, insights and key dates delivered to your inbox.


Comments
No comments yet