
Bioventus (BVS) Plunges 9.1%: A Sharp Correction Amidst Strong Technical Backdrop
 Aime Summary
Summary
• BioventusBVS-- (BVS) shares plummeted 9.1% to $13.87, erasing significant intraday gains.

• The stock traded in a wide range between a high of $15.02 and a low of $13.72.
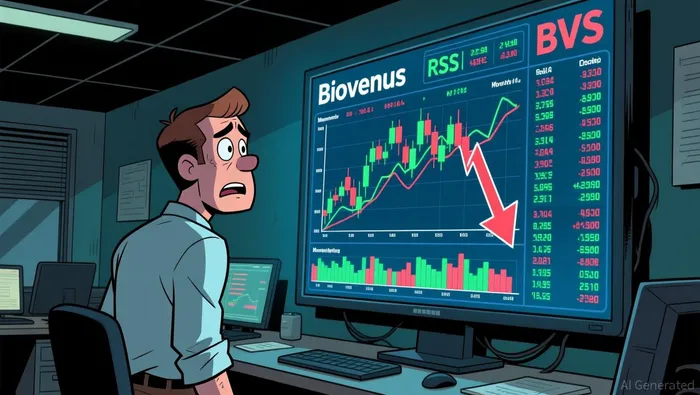
• Trading volume surged to 1,218,227 shares with a turnover rate of 2.61%.
• Despite the drop, the stock remains above key long-term moving averages, signaling underlying strength.
Bioventus delivered a volatile session on August 6, 2026, as selling pressure overwhelmed early bullish momentum. The stock opened near the previous close at $15.01 but quickly succumbed to bearish forces, closing near the day's lows. This sharp reversal highlights the delicate balance between short-term profit-taking and the stock's longer-term bullish structure, leaving traders assessing whether this is a healthy pullback or a trend reversal.
Intraday Reversal and Profit-Taking Pressure
The primary driver of Bioventus's 9.1% decline appears to be aggressive profit-taking and a failure to sustain the opening breakout. After opening at $15.01, the stock briefly touched an intraday high of $15.02 but lacked the volume momentum to hold above the $15.00 psychological level. As buying interest dried up, sellers stepped in, driving the price down to a low of $13.72. The lack of specific company news suggests this move is technical in nature, likely triggered by traders locking in gains after the stock had recently rallied from its 52-week low of $6.255. The high turnover rate of 2.61% indicates active participation and a significant shift in sentiment from bullish to cautious within a single session.
Health Care Equipment Sector Weakness
Bioventus's decline occurred against a backdrop of mild weakness in the broader Health Care Equipment sector. Sector leader Stryker (SYK) experienced a slight intraday dip of 0.52%, indicating that the selling pressure in BVSBVS-- was not isolated to idiosyncratic factors but rather part of a broader risk-off sentiment in the medical device space. However, BVS's 9.1% drop significantly outpaced the sector leader, suggesting that company-specific technical factors or larger position adjustments were at play rather than just sector-wide headwinds.
Technical Analysis and Strategic Options Plays
The technical landscape for Bioventus presents a complex picture of short-term weakness against a long-term bullish trend. Key indicators suggest the stock is overbought on the daily scale but remains supported by longer-term averages.
• 200-day moving average: $8.94 (strong support below)
• 30-day moving average: $11.79 (near-term support)
• RSI (14): 75.13 (overbought territory)
• MACD Histogram: 0.17 (positive momentum)
• Bollinger Bands Upper: $14.37 (resistance)
The stock is currently trading above its 30-day and 200-day moving averages, indicating a healthy long-term uptrend. However, the RSI of 75.13 signals that the stock is overbought, which often precedes a short-term correction. The MACD remains positive, suggesting that the overall momentum is still upward, but the sharp drop today has brought the price back toward the lower Bollinger Band ($10.62) and the 30-day SMA ($11.79). With no leveraged ETFs available for direct sector exposure, the focus shifts to options strategies that capitalize on volatility.
Based on the provided options chain, we identify two contracts that offer a compelling risk-reward profile for traders expecting continued volatility or a bounce from support.
Selection 1: BVS20260918P15BVS20260918P15--
• Contract Code: BVS20260918P15
• Type: Put Option
• Strike Price: $15.00
• Expiration: September 18, 2026
• Implied Volatility (IV): 120.83%
• Leverage Ratio: 4.70%
• Delta: -0.485
• Theta: -0.016
• Gamma: 0.069
• Turnover: 0
This contract is marked by its high delta, indicating a near 1:1 sensitivity to the underlying stock's price movement. The IV of 120.83% is elevated, reflecting market expectation of significant price swings. The gamma of 0.069 suggests that the delta will change rapidly with price movements, offering high sensitivity. Although turnover is zero, the high IV and delta make it a strong candidate for hedging against further downside.
Selection 2: BVS20260821C15BVS20260821C15--
• Contract Code: BVS20260821C15
• Type: Call Option
• Strike Price: $15.00
• Expiration: August 21, 2026
• Implied Volatility (IV): 59.86%
• Leverage Ratio: 46.23%
• Delta: 0.293
• Theta: -0.030
• Gamma: 0.198
• Turnover: 1,707
This call option offers high leverage of 46.23% with a moderate delta of 0.293, making it suitable for speculative bullish bets. The gamma of 0.198 is exceptionally high, indicating that the option's price will react sharply to small changes in the stock price. The turnover of 1,707 provides sufficient liquidity for entry and exit. The IV of 59.86% is moderate, balancing cost and potential return.
Options Payoff Calculation Primer: For this payoff estimation, we assume a 5% downside scenario from current price (13.87) where for Call Option Payoff = max(0, ST - K) where ST is projected price and K is strike price and Put Option Payoff = max(0, K - ST) where ST is projected price and K is strike price. This projection helps evaluate option contracts' potential returns under a bearish move scenario.
Aggressive traders may consider the BVS20260821C15 if the stock stabilizes above $13.50, betting on a short-term bounce. Conversely, risk-averse investors should watch for a break below $12.50, where the BVS20260918P15 could offer protection.
Monitor Support Levels for Trend Confirmation
Bioventus's sharp decline is likely a technical correction rather than a fundamental shift, given its position well above long-term moving averages. Investors should watch the $12.50–$13.00 support zone closely; a hold here would confirm the long-term bullish trend remains intact. However, a break below $12.50 could signal deeper weakness. Keep an eye on sector leader Stryker (SYK), which fell 0.52%, as its stability will influence broader market sentiment. For now, maintain a cautious stance and wait for signs of stabilization before adding positions.

TickerSnipe provides professional intraday stock analysis using technical tools to help you understand market trends and seize short-term trading opportunities.
Latest Articles
Stay ahead of the market.
Get curated U.S. market news, insights and key dates delivered to your inbox.


AInvest
PRO
AInvest
PRO




Comments
No comments yet