
Berachain Consolidates Near 0.1552 on Weak Volume
 Aime Summary
Summary
- Berachain consolidates near 0.1552 after testing support at 0.1549.
- Volume remains below 7-day averages, indicating weak market participation.
- Market structure is range-bound with no clear directional bias.
- Recent price action shows indecision with multiple rejection wicks.
- Key resistance at 0.1583 limits immediate upside potential.
Market Overview: Range-Bound Consolidation
Berachain/Tether (BERAUSDT) trades near 0.1552 following a 24-hour session with approximately 135,000 total volume. Price action remains compressed within a tight range, reflecting cautious investor sentiment and a lack of significant directional momentum in the current market phase.
1-Hour Support/Resistance and Candlestick Patterns
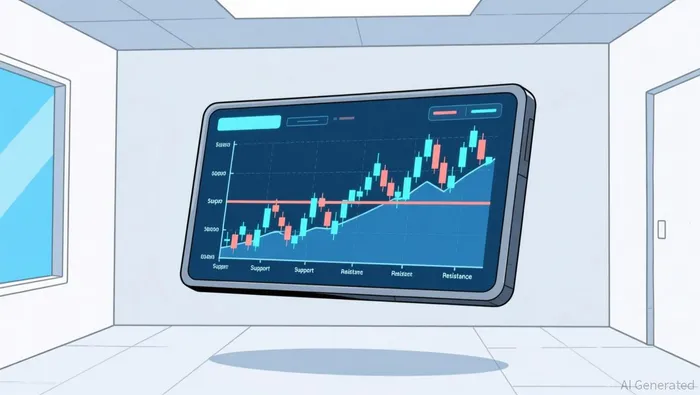
Price action over the last 24 hours highlights a defined trading range with clear rejection points at both extremes. The level at 0.1583 acted as immediate resistance, evidenced by the hour ending at 02:00 on August 4th, where a bearish engulfing pattern formed after price touched 0.1580, signaling strong selling pressure at that threshold. Conversely, support is evident at 0.1549, which was tested multiple times, including a notable low at 02:00 and again at 08:00, where the price failed to break lower despite high volume. The presence of a bearish engulfing candle at 02:00 and a bullish engulfing candle at 09:00 suggests rapid shifts in short-term sentiment, yet the price remains anchored between these two levels. Current price action is closer to the support zone of 0.1549 than the resistance at 0.1583, indicating slight bearish pressure within the consolidation phase.
Volume and Turnover vs. Historical Comparison
The 24-hour trading volume of approximately 135,000 is significantly lower than both the 7-day average daily volume of 102,011 and the 15-day average of 206,370, suggesting a substantial decrease in market activity. When examining hourly metrics, the average 7-day single-hour volume is roughly 4,250. Several hours exceeded twice this baseline, notably the spike at 02:00 on August 4th with 24,564 volume and 06:00 with 16,850 volume. Despite the high volume at 02:00, the price dropped from 0.1566 to 0.1549, showing effective selling pressure. However, the subsequent hours with elevated volume, such as 06:00, did not result in a sustained trend, as price merely oscillated between 0.1555 and 0.1561. This pattern of high volume without strong follow-through suggests that the volume anomalies did not drive a decisive market direction but rather facilitated redistribution within the existing range.
Look Back: Current Market Phase
Analyzing the broader structure from the provided 15-day data reveals a market that is currently range-bound. The 15-day daily price range is reported as 0.05, which is well within the 10% threshold for sideways movement. While there were periods of higher volatility in late July, the recent weeks show a compression of price action with lower highs and lower lows that are not sustained enough to confirm a downtrend. The market appears to be in a consolidation phase where price is oscillating between established support and resistance levels without breaking out. This structure suggests that mean reversion strategies may be more applicable than trend-following approaches in the immediate term, as the market lacks the momentum required for a sustained directional move.
The market may continue to consolidate near 0.1550 over the next 24 hours. An upside risk emerges if price breaks above 0.1583 with volume, while downside risk increases if support at 0.1549 fails to hold.

Decoding market patterns and unlocking profitable trading strategies in the crypto space
Latest Articles
Stay ahead of the market.
Get curated U.S. market news, insights and key dates delivered to your inbox.


AInvest
PRO
AInvest
PRO




Comments
No comments yet