
BELUSDT Sellers Block Breakout at 0.0988
 Aime Summary
Summary
- BELUSDT trades in a tight range near 0.0969, facing rejection at 0.0988 resistance.
- Volume spikes at 00:00 failed to sustain upward momentum, indicating seller dominance.
- Market structure remains range-bound with no clear directional breakout signals.
- Support holds at 0.0966 while resistance tests 0.0988 with repeated wick rejections.
- Caution advised as consolidation continues without significant volume confirmation for a trend.
Sideways Consolidation
Bella Protocol/Tether (BELUSDT) closed at 0.0966 following a volatile session with a high of 0.0988 and low of 0.0963. Total 24-hour volume reached approximately 2.3 million USDT, reflecting moderate trading activity.
1-Hour Support/Resistance and Candlestick Patterns
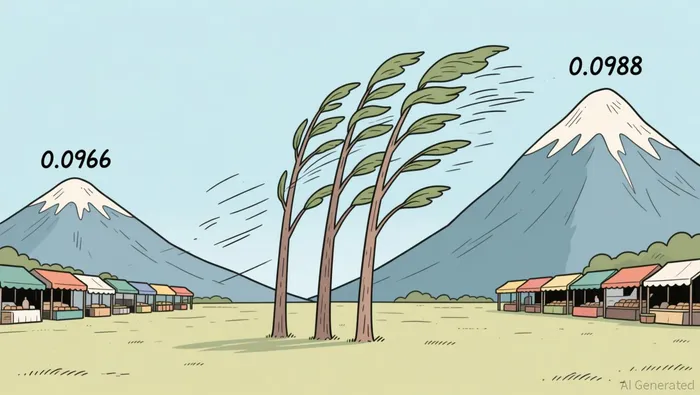
Price action suggests a range-bound environment where support and resistance levels are clearly defined by recent rejections. The asset encountered significant resistance at 0.0988, marked by a long upper shadow candle at 00:00 on August 4, indicating strong selling pressure at that level. Another rejection occurred at 0.0979, where a bearish engulfing pattern formed, confirming the difficulty in sustaining higher prices. Support is observed around 0.0966, where a long lower shadow candle appeared at 06:00, showing buyer intervention. The current price of 0.0966 is closer to the support level of 0.0966 than the resistance at 0.0988, suggesting a slight bearish bias within the range. The presence of multiple long wicks and engulfing patterns highlights indecision and the effectiveness of the current boundaries.
Volume and Turnover vs. Historical Comparison
The 24-hour total volume of approximately 2.3 million USDT is consistent with the 15-day average daily volume of 2.8 million, though it sits slightly below the 7-day average of 2.3 million, indicating neutral to slightly lower participation. Notable volume spikes occurred at 00:00 with 414,997 USDT and at 10:00 on August 3 with 318,394 USDT, both exceeding double the average single-hour volume of roughly 96,484 USDT. Following the spike at 00:00, the price initially moved up to 0.0988 but failed to hold, closing lower at 0.0969, which suggests high volume did not drive effective follow-through. Similarly, the spike at 10:00 on August 3 was followed by a price drop, reinforcing that volume anomalies were absorbed by sellers. This lack of sustained momentum after high-volume events suggests that the current volume is not sufficient to break the established range.
Look Back: Current Market Phase
The market structure over the past 7 to 15 days appears to be range-bound. The 15-day daily price range is reported as 0.01, which is narrow, and the price has fluctuated between approximately 0.0934 and 0.0988 without establishing a clear sequence of higher highs and higher lows or lower highs and lower lows. The recent 7-day price change is positive at 2.33%, but this move has been contained within a tight band, preventing the formation of a distinct uptrend or downtrend. The absence of significant price expansion and the repeated rejections at similar levels indicate that the market is currently in a consolidation phase. This sideways movement suggests that participants are waiting for a catalyst to break the current equilibrium.
Looking ahead, the next 24 hours could see continued consolidation within the 0.0963 to 0.0988 range. An upside breakout above 0.0988 with confirmed volume could signal a move toward 0.1000, while a breakdown below 0.0963 may expose further downside to 0.0950.

Decoding market patterns and unlocking profitable trading strategies in the crypto space
Latest Articles
Stay ahead of the market.
Get curated U.S. market news, insights and key dates delivered to your inbox.


AInvest
PRO
AInvest
PRO




Comments
No comments yet