
BCHUSDT Traps Buyers at 214.7 as Selling Pressure Mounts
 Aime Summary
Summary
- BCHUSDT trades in a tight range between 212.3 and 214.7, showing indecision.
- Volume remains below historical averages, suggesting weak conviction in current price action.
- Multiple long upper shadows indicate persistent selling pressure near 214.0.
- Support at 212.3 is tested frequently, while resistance holds firmly above.
- Market appears range-bound with no clear directional momentum for the next 24 hours.
Market Overview
Range-Bound Indecision
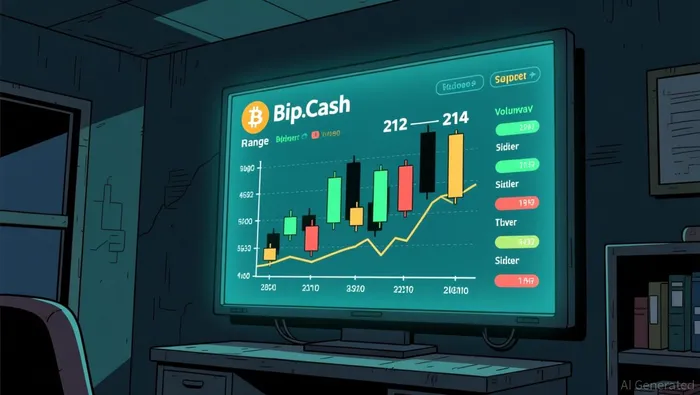
Bitcoin Cash/Tether (BCHUSDT) traded between 212.3 and 214.7 over the last 24 hours, with a total volume of approximately 2,350 BCH. The market shows consolidation with low volatility and no significant volume spikes driving directional movement.
1-Hour Support/Resistance and Candlestick Patterns
Price action suggests a constrained trading environment with clear boundaries. The level near 214.0 to 214.7 has acted as a recurring resistance, evidenced by multiple rejections where price failed to sustain breaks above this zone. Specifically, the hour ending at 02:00 on August 4th and 09:00 on August 4th both exhibited long upper shadows, indicating that buyers pushed price up but sellers quickly rejected higher levels. Conversely, support appears to be forming around 212.3 to 212.7, where price found bids during the 20:00 hour on August 3rd and the 12:00 hour on August 4th. The candlestick patterns reinforce this hesitation; several candles display long upper shadows, which implies that for every attempt to move higher, selling pressure emerged to cap gains. The price is currently closer to the lower end of this range, hovering near 213.5, which suggests a slight bearish lean within the consolidation. There are no engulfing patterns or narrow consecutive dojis that signal an imminent breakout, pointing instead to a equilibrium state where neither side holds dominance.
Volume and Turnover vs. Historical Comparison
The total 24-hour volume for BCHUSDTBCH-- is approximately 2,350 BCH. When compared to the 15-day average daily volume of 1,963.59 BCH, the current day shows slightly elevated activity, but this is misleading when looking at hourly distribution. The 7-day average single-hour volume is 92.35 BCH. While several hours exceeded this baseline, such as the 19:00 hour on August 3rd (390.08 BCH) and the 21:00 hour on August 3rd (579.68 BCH), these spikes did not result in sustained directional trends. For instance, the high volume at 21:00 on August 3rd was followed by a price increase of only 0.56% over the next 3 hours, and the subsequent hours saw mixed results with no clear follow-through. This indicates that the volume anomalies were likely due to profit-taking or local liquidity adjustments rather than strong institutional accumulation or distribution. The lack of high volume accompanied by significant price expansion suggests that the current volume is not effectively driving the price out of its range.
Look Back: Current Market Phase
Analyzing the structure over the past 7 to 15 days, the market is clearly in a sideways or range-bound phase. The 15-day daily price range is 22.4 units, which, relative to the price level of roughly 213, represents a consolidation rather than a strong trend. There are no distinct lower highs and lower lows that would characterize a downtrend, nor are there higher highs and higher lows indicative of an uptrend. The price has been oscillating within a defined band, reacting to support and resistance levels repeatedly. This behavior is consistent with a mean reversion environment where price tends to return to the mean after deviations. The recent 3-day and 7-day changes are minimal (0.85% and 1.19% respectively), further confirming the lack of strong directional momentum. Consequently, the market is likely to continue this choppy, range-bound behavior until a decisive volume-driven breakout occurs.
Looking ahead, BCHUSDT may continue to oscillate within the 212.3 to 214.7 range over the next 24 hours. A break below 212.3 could expose downside risk toward 211.5, while a sustained move above 214.7 might signal a shift toward testing 215.0.

Decoding market patterns and unlocking profitable trading strategies in the crypto space
Latest Articles
Stay ahead of the market.
Get curated U.S. market news, insights and key dates delivered to your inbox.


AInvest
PRO
AInvest
PRO




Comments
No comments yet