
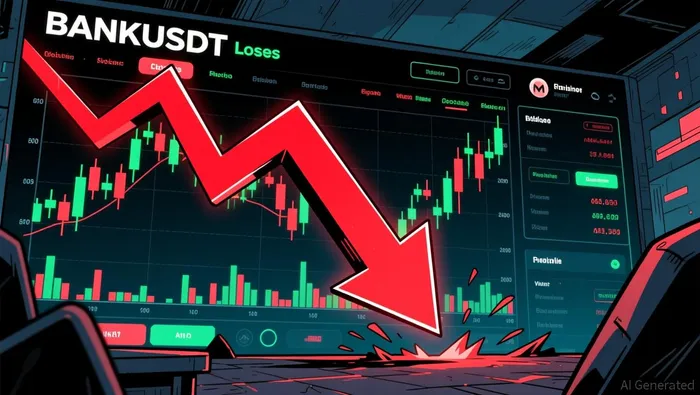
BANKUSDT Plunges 85% as Sellers Block Recovery
 Aime Summary
Summary
- BANKUSDT trades near multi-week lows following a severe 85% weekly decline.
- Price action shows lower lows, indicating sustained bearish market structure.
- Volume spikes on rallies fail to drive sustained upward momentum.
- Key support at 0.0560 tested repeatedly with weak follow-through buying.
- Resistance at 0.0742 remains a strong barrier for any short-term recovery.
Severe Downtrend Continuation
Lorenzo Protocol/Tether (BANKUSDT) closed the latest hour at 0.05749 with a range of 0.05715–0.06347. The 24-hour total volume was approximately 73.5 million, while turnover metrics reflect the depressed liquidity. The asset remains in a critical weakness phase.
1-Hour Support/Resistance and Candlestick Patterns
Price action reveals a clear dominance of lower lows, confirming a bearish structure. The nearest significant support level is 0.0560, which has been tested multiple times, including the low of 0.05373 on July 31 and 0.05715 on August 1. Resistance is firmly established at 0.0742, where the price rejected during the early hours of August 1. Candlestick patterns indicate indecision and selling pressure; specifically, a long upper shadow on August 1 at 00:00 suggests rejection of higher prices, followed by a bearish engulfing pattern at 02:00 which closed near the lows. The current price of 0.05749 is significantly closer to the 0.0560 support than the 0.0742 resistance, suggesting limited upside room in the immediate term.
Volume and Turnover vs. Historical Comparison
The 24-hour volume of roughly 73.5 million is notably lower than the 7-day average daily volume of 92.1 million and the 15-day average of 65.7 million, indicating a lack of aggressive participation. While the 7-day average hourly volume is approximately 3.8 million, several hours exceeded this, such as 08:00 on July 31 with 9.1 million and 00:00 on August 1 with 6.2 million. However, these volume spikes did not result in sustained price increases. For instance, the high volume at 00:00 on August 1 coincided with a price drop from 0.06094 to 0.06000, showing selling absorption. The volume anomalies appear to have been driven by distribution rather than accumulation, failing to provide the follow-through necessary for a trend reversal.
Look Back: Current Market Phase
The 7-day price change of -85.1% and a 3-day change of -6.3% clearly place BANKUSDTBANK-- in a severe downtrend. The market structure is defined by consistent lower highs and lower lows over the past 15 days. This is not a sideways range or a mean reversion setup, but a sustained bearish phase. The extreme volatility seen in late July, with multiple single-day drops exceeding 25%, confirms that sellers are in control. The market appears to be in a continuation phase of this downtrend, with any rallies being met with immediate selling pressure at higher levels.
Looking ahead, the price is likely to test the 0.0560 support again in the next 24 hours. A break below this level could accelerate downside risk toward 0.0530, while a recovery above 0.0635 would be required to suggest a potential short-term relief rally.

Decoding market patterns and unlocking profitable trading strategies in the crypto space
Latest Articles
Stay ahead of the market.
Get curated U.S. market news, insights and key dates delivered to your inbox.


AInvest
PRO
AInvest
PRO




Comments
No comments yet