
BANKUSDC Plunges 83% as Volume Fails to Fuel Recovery
 Aime Summary
Summary
- BANKUSDC trades near 0.0488 after severe 83% weekly drop.
- Price remains in strong downtrend with lower highs and lows.
- Key support at 0.0502 is critical for potential stabilization.
- Resistance at 0.0566 caps immediate upside recovery attempts.
- Volume spikes show failed bullish follow-through during rebounds.
Severe Correction Phase
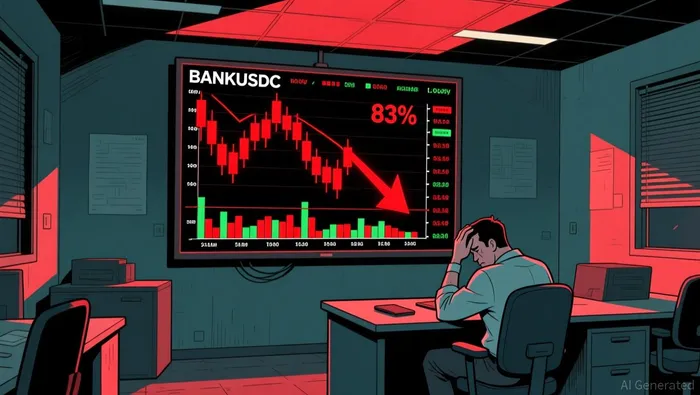
Lorenzo Protocol/USDC (BANKUSDC) closed the 24-hour period at 0.0488 with a total volume of approximately 7.4 million. The asset exhibits a deteriorating market structure following a significant 83% decline over the past week.
1-Hour Support/Resistance and Candlestick Patterns
Price action indicates a clear bearish bias as the current level sits closer to the immediate support zone near 0.0502 rather than the resistance at 0.0566. Recent hourly candles have demonstrated repeated rejections at higher levels, reinforcing the downward pressure. Specifically, the hour at 2026-08-01 16:00 displayed a bearish engulfing pattern where the closing body fully covered the prior candle, signaling strong selling pressure. Additionally, multiple hours including 2026-08-01 21:00 and 2026-08-02 03:00 showed long lower shadows, suggesting brief attempts by buyers to push prices up were quickly rejected. The presence of narrow consecutive dojis on 2026-08-01 15:00 and 2026-08-02 08:00 indicates periods of indecision, but the subsequent bearish engulfing candle at 00:00 confirmed the continuation of the sell-off.
Volume and Turnover vs. Historical Comparison
The 24-hour trading volume of approximately 7.4 million is notably below both the 7-day average daily volume of roughly 17.9 million and the 15-day average of 17.4 million, indicating a lack of aggressive participation at these lower levels. While there were no single-hour volumes exceeding twice the 7-day average hourly volume, several hours saw elevated activity relative to the immediate trend. For instance, the hour ending at 2026-08-01 14:00 recorded high volume with a price decline, followed by continued downward movement in the subsequent hours. This pattern suggests that the volume anomalies did not effectively drive a price reversal but rather facilitated distribution. The absence of significant volume spikes during the minor intraday bounces implies that buyers are not stepping in with conviction, leaving the price vulnerable to further declines.
Look Back: Current Market Phase
The market structure over the past 7 to 15 days clearly defines a downtrend characterized by lower highs and lower lows. The 7-day price change of -83.69% and a 3-day change of -18.12% confirm a severe correction phase rather than a sideways consolidation or mean reversion setup. The asset has not yet formed a higher low or broken above any significant resistance to suggest a trend change. Consequently, the current phase is best described as a sustained downtrend where selling pressure dominates, and any short-term rallies are likely to be met with resistance.
Looking ahead, the asset may continue to test lower support levels if the 0.0502 zone fails to hold. An upside breakout above 0.0566 would be required to suggest a potential stabilization, while a breakdown below 0.0502 could expose further downside risk toward the next support level.

Decoding market patterns and unlocking profitable trading strategies in the crypto space
Latest Articles
Stay ahead of the market.
Get curated U.S. market news, insights and key dates delivered to your inbox.


AInvest
PRO
AInvest
PRO




Comments
No comments yet