
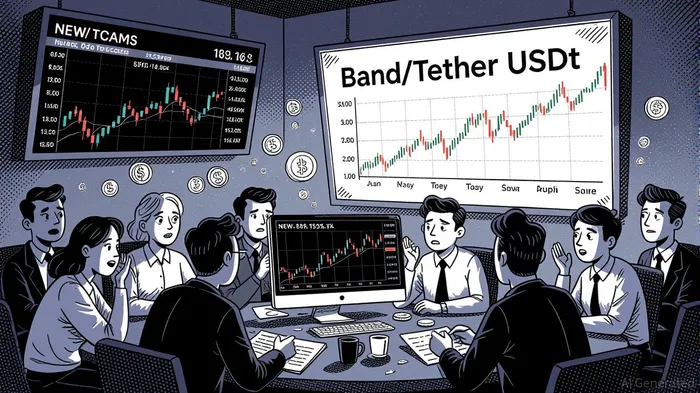
Band/Tether USDt Market Overview
• Price surged over 6.7% on strong volume in late ET, breaking above key resistance at 0.73
• Momentum indicators show overbought conditions, suggesting possible near-term consolidation
• BollingerBINI-- Bands expanded sharply as volatility increased with price action pushing to the upper band
• Volume spiked during early morning ET, confirming bullish moves, but shows signs of tapering
• Fibonacci levels highlight critical support at 0.723 and potential resistance at 0.744
Band/Tether USDt (BANDUSDT) opened at $0.715 on 2025-09-05 12:00 ET, traded between $0.712 and $0.760 over the next 24 hours, and closed at $0.737 at 12:00 ET. Total volume reached 1,136,135.7, and notional turnover stood at $822,630.82.
Structure & Formations
Price formed a bullish continuation pattern over the past 24 hours, breaking out of a tight consolidation phase between 0.723 and 0.735. A bullish engulfing pattern emerged around 09:45 ET, confirming the breakout. Key support levels are at 0.723 and 0.716, while resistance appears at 0.744 and 0.756. A doji formed at 10:00 ET, indicating indecision after a sharp move up, potentially foreshadowing a pullback.
Moving Averages
On the 15-minute chart, the 20-period MA is at 0.731 and the 50-period MA is at 0.732, showing a bullish crossover. The 50-period and 200-period daily MAs are at 0.735 and 0.730, respectively, suggesting the pair is above its mid-term trend and showing strong short-term momentum.
MACD & RSI
MACD turned bullish with a positive crossover at 09:15 ET, reinforcing the breakout. The histogram has remained positive since 09:30 ET, indicating strong upward momentum. RSI reached overbought territory at 70+, currently at 68, suggesting a possible short-term correction. However, as long as RSI stays above 50, the bullish trend remains intact.
Bollinger Bands
Bollinger Bands expanded significantly in the early hours of 2025-09-06, reflecting increased volatility. Price has remained within the upper band since 09:45 ET, indicating strong buying pressure. A contraction in the bands could precede a directional move, but current positioning near the upper bound suggests continuation of the bullish trend in the short term.
Volume & Turnover
Volume spiked dramatically between 09:45 ET and 10:45 ET, especially at 10:45 ET where a large volume of 585,460.5 was recorded. This spike coincided with a price increase to 0.744, confirming the bullish breakout. However, volume has been declining since 11:45 ET, which could signal exhaustion in the move up. The notional turnover followed the volume closely, suggesting strong conviction in the upward move during the breakout phase.
Fibonacci Retracements
On the 15-minute chart, the 38.2% retracement level sits at 0.732 and the 61.8% level at 0.738. Price tested the 61.8% level at 10:45 ET but showed no rejection, continuing higher. On the daily chart, the 38.2% and 61.8% levels are at 0.732 and 0.738, aligning with recent support/resistance levels. These suggest potential consolidation zones if price pulls back from 0.744.
Backtest Hypothesis
The observed breakout pattern and bullish confirmation through volume and momentum indicators could form the basis of a short-term breakout strategy. A backtest could be constructed to enter long on a breakout above the 0.732 level with a stop-loss below 0.725 and a target at 0.744, aligning with the recent Fibonacci and resistance levels. Given the confirmation from the RSI and MACD, this strategy could be effective in capturing the trend continuation over the next 24–48 hours.
Decoding market patterns and unlocking profitable trading strategies in the crypto space
Latest Articles
Stay ahead of the market.
Get curated U.S. market news, insights and key dates delivered to your inbox.


Comments
No comments yet