
B3USDT Rejects Resistance, Eyes Critical 0.0004500 Support
 Aime Summary
Summary
- B3USDT trades near 0.0004519 after rejecting key resistance.
- Volume remains below historical averages, indicating weak conviction.
- Market structure shows lower lows, confirming a downtrend phase.
- Bearish engulfing patterns suggest sellers maintain short-term control.
- Downside risk persists if support at 0.0004500 breaks.
Severe Correction
B3/Tether (B3USDT) closed the latest hour at 0.0004519 on August 4, 2026. The 24-hour total volume was approximately 4.7 million, significantly trailing the 7-day average of 6.8 million per hour. This indicates a lack of strong buyer participation and potential liquidity drift.
1-Hour Support/Resistance and Candlestick Patterns
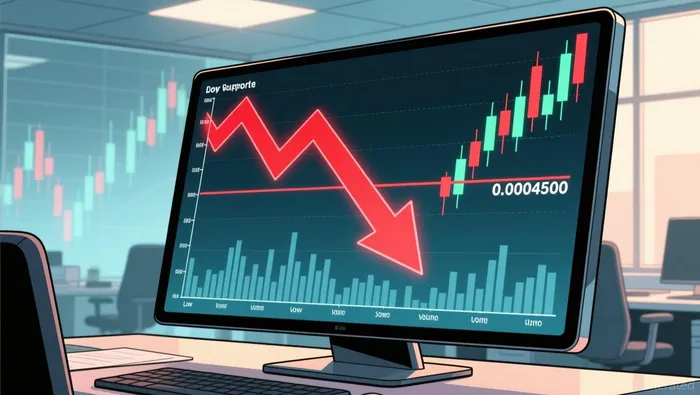
Price action has established a clear resistance zone around 0.0004580 to 0.0004600, evidenced by multiple rejections including the hour ending at 08:00 on August 3 where the price failed to sustain above 0.0004539. A significant rejection occurred at 0.0004584 during the 21:00 hour on August 3, marked by a long upper shadow indicating strong selling pressure at that level. On the support side, 0.0004500 acts as a critical floor, tested multiple times in the last 24 hours. The candlestick patterns reveal a mix of indecision and bearish pressure; specifically, a bearish engulfing pattern appeared at 09:00 on August 3, followed by another at 19:00 on August 3 and 03:00 on August 4. These patterns suggest that whenever buyers attempt to push prices higher, sellers step in aggressively. The current price of 0.0004519 is closer to the immediate support level of 0.0004500 than to the resistance at 0.0004580, suggesting that the near-term momentum favors downside continuation if support fails.
Volume and Turnover vs. Historical Comparison
The 24-hour total volume for B3USDT is approximately 4.7 million, which is drastically lower than the 7-day average hourly volume of 6.8 million and the 15-day average daily volume of 217 million. This indicates that the current trading session is experiencing a significant volume contraction compared to historical norms. There were no hours in the last 24 hours where volume reached 2 times the 7-day average single-hour volume (i.e., exceeding 13.6 million). The highest volume hour was at 21:00 on August 3 with 39.6 million, which coincided with a sharp price drop but lacked sustained follow-through in subsequent hours, as prices stabilized rather than crashed further. This high volume with no follow-through suggests that the selling pressure was absorbed by passive buyers or that the move was a liquidity grab rather than a fundamental shift. The absence of volume spikes in the most recent hours suggests that the current price decline is not being driven by aggressive panic selling, but rather by a lack of buying interest.
Look Back: Current Market Phase
The market structure over the last 15 days is characterized by lower highs and lower lows, indicating a clear downtrend. The 7-day price change is negative at -6.94%, reinforcing the bearish bias. The 3-day change is slightly positive at 0.24%, but this appears to be a minor relief rally within a broader downtrend rather than a trend reversal. The market is not in a sideways phase, as the price has broken below key support levels identified in the 15-day data. The current phase is best described as a downtrend with consolidation, where price action is finding temporary equilibrium but failing to establish higher highs. The presence of multiple lower lows in the recent hourly data confirms that sellers are in control.
Forward-looking judgment for next 24h + upside/downside risk on key level breaks:
The market may continue to test lower support levels if the 0.0004500 support breaks, potentially leading to a further decline toward 0.0004400. Upside risk is limited unless price can reclaim and hold above 0.0004600, which would suggest a potential reversal of the immediate downtrend.

Decoding market patterns and unlocking profitable trading strategies in the crypto space
Latest Articles
Stay ahead of the market.
Get curated U.S. market news, insights and key dates delivered to your inbox.


AInvest
PRO
AInvest
PRO




Comments
No comments yet