
B3USDT Downtrend Holds: Low Volume Signals Weak Momentum
 Aime Summary
Summary
- B3USDT trades near 0.000454 with low volume, indicating weak momentum.
- Market structure shows lower lows, confirming a short-term downtrend.
- Key resistance at 0.000463 limits upside potential for bulls.
- Strong support at 0.000448 may provide temporary stabilization.
- Caution advised as volatility remains low with no clear breakout.
Market Overview
B3/Tether (B3USDT) is currently trading around 0.000454, with a 24-hour total volume of approximately 100 million USDT. The asset exhibits low liquidity and indecisive price action, reflecting a consolidation phase within a broader downward structure. Traders should monitor key support and resistance levels closely for potential directional moves.
1-Hour Support/Resistance and Candlestick Patterns
The current price action is bounded by immediate resistance near 0.000463 and support around 0.000448. Price rejections have occurred multiple times near these levels, indicating strong opposition from sellers at higher prices and buyers stepping in at lower levels. Candlestick patterns such as bearish engulfing and long upper shadows suggest selling pressure dominates during rallies. Conversely, bullish engulfing patterns followed by long lower shadows indicate brief buying interest that fails to sustain momentum. The price is currently closer to the mid-range between support and resistance, showing no clear directional bias.
Volume and Turnover vs. Historical Comparison
The 24-hour total volume is significantly lower than both the 7-day and 15-day average daily volumes, suggesting reduced market participation. Hours with volume spikes, particularly those exceeding twice the 7-day average single-hour volume, show mixed price reactions. For instance, a notable spike at 21:00 on August 3rd resulted in a small price increase but failed to sustain upward momentum in the following hours. High volume periods often coincide with reversals or consolidations rather than sustained trends, indicating that volume anomalies have not effectively driven price movement. This lack of follow-through suggests weak conviction among traders.
Look Back: Current Market Phase
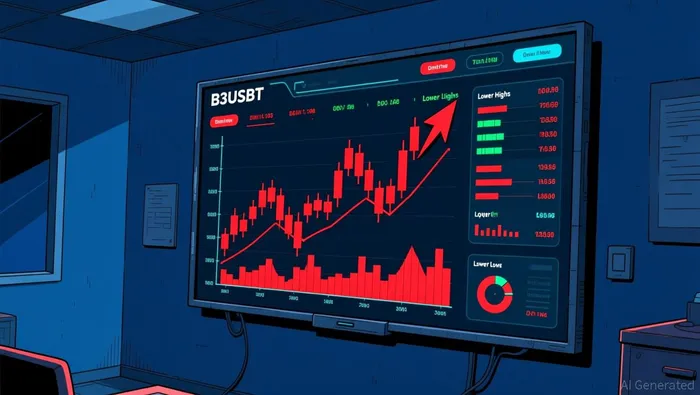
Over the past 7 to 15 days, the market structure has consistently formed lower highs and lower lows, characteristic of a downtrend. The recent 3-day price change shows a slight uptick, but the 7-day change remains negative, reinforcing the bearish bias. The market appears to be in a corrective phase within a larger downtrend, with no signs of a sustained reversal. Mean reversion dynamics may play a role if prices deviate significantly from recent averages, but current conditions suggest continued weakness. Traders should remain cautious as the overall trend remains downward.
The next 24 hours may see continued consolidation unless a decisive break above resistance or below support occurs. Upside risk is limited unless the price can hold above 0.000463, while downside risk increases if support at 0.000448 fails.

Decoding market patterns and unlocking profitable trading strategies in the crypto space
Latest Articles
Stay ahead of the market.
Get curated U.S. market news, insights and key dates delivered to your inbox.


AInvest
PRO
AInvest
PRO




Comments
No comments yet