
AXTI Surges 29% After Record Q2 Earnings: Key Levels to Watch
 Aime Summary
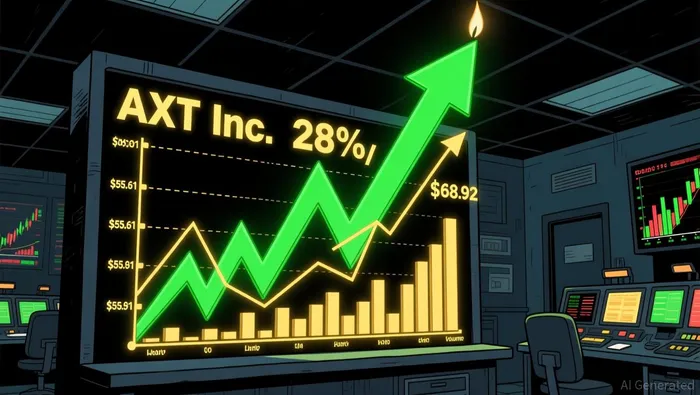
AXT Inc (AXTI) exploded higher on July 31, surging 28.74% in heavy volume after reporting record quarterly revenue and a massive earnings beat the prior evening. The stock gapped up more than 42% at the open before closing near the middle of the day's range, leaving traders with a classic post-earnings dilemma: does the gap mark the start of a sustained rally, or does the intraday pullback signal exhaustion? According to Yahoo Finance market movers, AXTIAXTI-- ranked as one of the top gainers for the session.
Why This Setup Matters Now
AXTI entered the technical-analysis queue after appearing on the day-gainers screen with a double-digit percentage move on volume roughly 6 times its recent daily average, according to Yahoo Finance screener data. The catalyst was a clear fundamental trigger: Q2 2026 revenue of $47.6 million (up 164% year-over-year) and adjusted EPS of $0.19 crushing the $0.07 consensus estimate, as reported by Investing.com. Gross margin expanded to 45% from 29.9% in Q1, driven by indium phosphide demand for AI data-center optical connectivity.
| Metric | Value |
|---|---|
| Ticker | AXTI (AXT Inc) |
| Catalyst | Q2 2026 earnings beat |
| July 31 Close | $60.43 |
| Day Change | +$13.49 (+28.74%) |
| Day Range | $55.61 - $68.92 |
| Volume | 29.55 million |
| 52-Week Range | $1.90 - $143.16 |
| Source | Yahoo Finance |
Quick Read
The central technical question is whether the July 31 gap-up was the beginning of a trend reversal or a one-day momentum spike that needs consolidation.
| Question | Assessment |
|---|---|
| Is the stock above its 20-day SMA? | Yes ($60.43 vs $52.39) |
| Did volume confirm the move? | Yes (29.6M vs ~7M average) |
| Is RSI overbought? | No (RSI 51, neutral) |
| Did the stock close near the high? | No (closed well below $68.92 high) |
| Is MACD positive? | No (MACD -8.55, still bearish) |
| Source | Investing.com Technicals |
Technical Bias
The technical scorecard is mixed. Price action and volume are strongly bullish, but lagging indicators like MACD remain in negative territory after the prolonged downtrend from the June highs.
| Factor | Signal | Weight |
|---|---|---|
| Price vs 20-day MA | Bullish (crossed above) | High |
| Volume | Bullish (6x average) | High |
| RSI (14) | Neutral (51.3) | Medium |
| MACD | Bearish (-8.55) | Medium |
| ADX | Neutral (44.5, strong trend) | Medium |
| CCI (20) | Bullish (167.8) | Low |
| Stochastics | Bearish (32.0) | Low |
| Source | Investing.com Technicals |
Key Levels To Watch
The following levels are derived from the July 31 trading range and recent price history. They are approximate zones and should not be treated as confirmed support or resistance until tested.
| Level | Price | Rationale |
|---|---|---|
| Resistance 1 | $68.92 | July 31 intraday high |
| Resistance 2 | $84.57 | June 18 close (pre-selloff) |
| Support 1 | $55.61 | July 31 intraday low (gap fill zone) |
| Support 2 | $46.94 | July 30 close (pre-gap) |
| Support 3 | $36.97 | July 29 low (recent swing bottom) |
Scenario Map
| Scenario | Condition | Target Zone |
|---|---|---|
| Bullish continuation | Stock holds above $55.61 on pullback | $68.92, then $84.57 |
| Bullish consolidation | Stock trades between $55.61 and $68.92 | Range-bound accumulation |
| Bearish gap fill | Stock breaks below $55.61 with volume | $46.94 - $55.61 |
| Trend failure | Stock falls below $46.94 | $36.97 or lower |
Momentum And Volume Check
Volume on July 31 reached 29.55 million shares, dwarfing the recent daily average of roughly 5-7 million. The prior session (July 30) also saw elevated volume at 18.6 million, suggesting institutional accumulation ahead of and after the earnings release. The RSI at 51.3 sits exactly at neutral, meaning the stock is neither overbought nor oversold despite the 29% gain -- a rare condition that leaves room for further upside without immediate mean-reversion pressure. However, the MACD line at -8.55 has not yet crossed above the signal line, indicating that the trend on a medium-term timeframe has not flipped bullish.
| Indicator | Value | Interpretation |
|---|---|---|
| July 31 Volume | 29.55M | 6x the recent daily average |
| July 30 Volume | 18.55M | Elevated pre-earnings |
| RSI (14) | 51.3 | Neutral, room to run |
| MACD | -8.55 | Still bearish, no crossover yet |
| ATR | 8.31 | Extremely wide range |
What Would Change The View
| Condition | Signal | Impact |
|---|---|---|
| Close above $68.92 on volume | Bullish breakout confirmation | Strengthens bullish bias |
| Hold above $55.61 on pullback | Support holds | Neutral-bullish |
| Close below $55.61 | Gap fill in progress | Shifts to neutral-bearish |
| MACD crosses above signal | Trend reversal confirmed | Adds medium-term conviction |
| Close below $46.94 | Gap fully filled | Invalidates breakout |
Bottom Line
Bottom line: AXTI remains cautiously bullish as long as it holds above the $55.61 gap-fill zone. A move above $68.92 would strengthen the setup and open the path toward the $84 region, while a break below $46.94 would fully negate the earnings gap and shift the chart back to bearish.
Summary
- AXTI surged 28.74% on July 31 after reporting record Q2 revenue and a 171% EPS beat.
- The stock gapped from $46.94 to open at $66.71, then pulled back to close at $60.43.
- Volume was 6x the daily average, signaling strong institutional interest.
- RSI at 51.3 is neutral, leaving room for further upside without overbought conditions.
- The key level to watch is $55.61 (gap support); a close below that would weaken the setup.
Disclaimer
This article is for informational purposes only and does not constitute financial advice. Technical indicators can help frame risk and momentum, but they do not guarantee future price movement.

Stay ahead of the market.
Get curated U.S. market news, insights and key dates delivered to your inbox.


AInvest
PRO
AInvest
PRO




Comments
No comments yet