
AXTI Stages A Two-Day Recovery After A Blowout Quarter
 Aime Summary
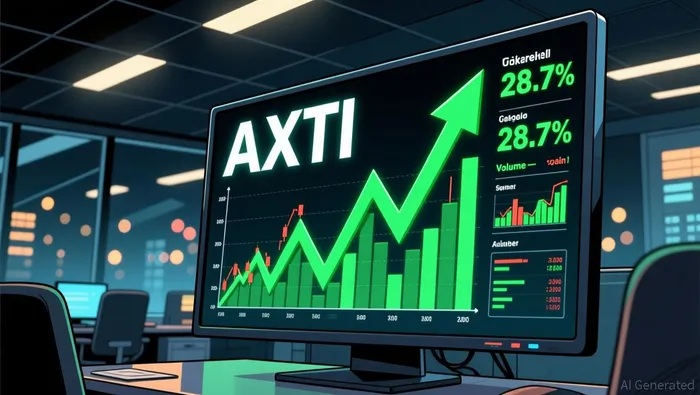
AXTI appeared near the top of the Yahoo Finance day gainers screen with a 28.7% surge on the latest session, extending a two-day rally of roughly 63% off a July low near $37. The move came after a Q2 earnings report that beat estimates on both profit and revenue. The open technical question is whether this is the start of a durable trend repair or a fast bounce that stalls into overhead supply below the 50-day average.
Why This Setup Matters Now
AXTI entered the technical-analysis queue because it produced the largest unused absolute move on the day gainers screen, according to Yahoo Finance market movers. The catalyst was the Q2 2026 earnings release on July 30, which showed EPS of $0.19 versus a $0.07 consensus and revenue of $47.6 million versus $30.4 million expected, a return to profitability on record revenue, per Investing.com. The report followed an earlier Coherent supply agreement covering indium phosphide wafer substrates, the product line tied to AI data center demand.
The snapshot below draws on the Yahoo Finance day gainers screen.
| Metric | Value |
|---|---|
| Symbol | AXTI (NASDAQ) |
| Last Price | $60.43 |
| Change | +$13.49 |
| Change % | +28.74% |
| Volume | 29.6M shares |
| 20-Day Avg Volume | ~9.6M shares |
| Previous Close | $46.94 |
| Source | Yahoo Finance |
Quick Read
The main question is whether the surge repairs the chart or simply reprices the earnings beat before overhead sellers appear.
| Question | Read |
|---|---|
| Prior trend | Down since early July |
| Catalyst | Q2 earnings beat |
| Two-day move | About +63% off the low |
| Price vs 200-day average | Above |
| Price vs 50-day average | Below |
| Initial verdict | Strong bounce, trend unconfirmed |
Technical Bias
The scorecard below uses moving averages and momentum computed from the AXTI daily chart.
| Factor | Reading | Lean |
|---|---|---|
| Price vs SMA20 ($52.39) | Above | Bullish |
| Price vs SMA50 ($77.52) | Below | Bearish |
| Price vs SMA100 ($76.24) | Below | Bearish |
| Price vs SMA200 ($46.75) | Above | Bullish |
| RSI-14 | ~51, neutral | Neutral |
| Volume trend | Expanding | Bullish |
| Net bias | Neutral to bullish short term | Mixed |
Key Levels To Watch
Levels below are derived from the AXTI daily chart. Exact levels carry a note where applicable; the rest are derived zones.
| Level | Type | Value |
|---|---|---|
| Resistance | Latest session high | $68.92 |
| Resistance | Early-July breakdown zone | $63.50 to $65.00 |
| Resistance | 50-day average, derived zone | ~$77.50 |
| Support | Gap base, latest session low | $55.60 |
| Support | Breakout base, prior close | $46.94 |
| Support | July swing low | $36.97 |
Scenario Map
| Scenario | Condition | Implication |
|---|---|---|
| Bullish continuation | Hold above $55.60 and clear $68.92 | Opens the $77 to $80 zone |
| Base and digest | Range between $55 and $69 | Rebuilding before the next leg |
| Bearish fade | Close back below $46.94 | Retest of $41 to $37 area |
Momentum And Volume Check
Volume is the strongest part of the setup. The latest session printed 29.6 million shares, about three times the 20-day average of roughly 9.6 million, according to the AXTI daily chart. RSI-14 sits near 51, neutral rather than overbought, which means the surge has not yet exhausted momentum. The caveat is that both strong sessions occurred from deeply oversold readings after a sharp July decline.
| Measure | Value | Read |
|---|---|---|
| Session volume | 29.6M shares | About 3x the 20-day average |
| Two-session change | About +63% | Fast, wide-range bars |
| RSI-14 | ~51 | Neutral, not overbought |
| Close vs SMA200 | Above | Longer-term floor holding |
| Close vs SMA50 | Below | Intermediate trend still down |
What Would Change The View
| Signal | Action |
|---|---|
| Daily close above $68.92 | Upgrade the view to constructive |
| Close back below $55.60 | Reduce confidence in the bounce |
| Close below $46.94 | View flips bearish |
| Volume dries up near resistance | Fade risk increases |
| Follow-through on positive headlines | Bullish confirmation |
Bottom Line
Bottom line: AXTIAXTI-- remains neutral to bullish in the short term as long as it holds above $55.60. A move above $68.92 would strengthen the setup, while a break below $46.94 would weaken the chart.
Summary
- AXTI rose 28.7% on the latest session and about 63% over two sessions after a strong Q2 earnings report.
- The stock is above its 20-day and 200-day averages but still below its 50-day and 100-day averages.
- Volume expanded to roughly three times its 20-day average, signaling conviction behind the move.
- First resistance is the $68.92 session high, with the 50-day average near $77.50 as the larger test.
- The view turns constructive on a close above $68.92 and bearish on a close below $46.94.
Disclaimer
This article is for informational purposes only and does not constitute financial advice. Technical indicators can help frame risk and momentum, but they do not guarantee future price movement.

Stay ahead of the market.
Get curated U.S. market news, insights and key dates delivered to your inbox.


AInvest
PRO
AInvest
PRO




Comments
No comments yet