
AXT Surges 85% on Technicals, But Cash Flow Tells a Different Story
 Aime Summary
The Big Picture: AXTAXTI-- is Climbing, but Is the Foundation Solid?
AXT (AXTI.O) is currently enjoying a strong technical breakout, with the stock price rising 85.00% in recent sessions, driven by bullish chart patterns and positive analyst sentiment, even as underlying cash flow metrics show signs of strain.

Recent Headlines: What’s Moving the Market?
The most significant recent development impacting the semiconductor equipment space involves Taiwan Semiconductor Manufacturing Company (TSM). On August 9, 2026, HF Advisory Group LLC sold shares of TSMTSM--. While this is a direct transaction in a peer company, it serves as a critical sentiment indicator for the broader sector. TSM currently holds a "Buy" consensus with an average target price of $496.25, supported by 15 Buy/Strong Buy ratings against just one Hold. The sale by HF Advisory suggests a rebalancing or profit-taking at the top by a specific hedge fund, rather than a fundamental loss of faith in the AI-driven demand narrative. For AXT, this reinforces the idea that while the sector is strong, volatility and selective selling at major peaks are normal.
Analyst Sentiment: A Tale of Two Schools
Wall Street is currently divided, but leaning slightly bullish. The simple average rating score is 3.67, while the performance-weighted rating score is higher at 4.51, suggesting that analysts with better historical track records are more optimistic.
- Needham (Charles Shi): Recently issued a "Strong Buy" on July 31, 2026. Needham has a solid historical winning rate of 66.7% with an average historical return of 31.72%.
- B. Riley Securities (Dave Ku Kang): Issued two "Neutral" ratings recently (July 28 and 31). Their historical winning rate is lower at 20.0%, though their historical average return is high at 40.26%.
The market expectation is currently neutral, which contrasts with the 85.00% price rise. This divergence suggests the market is waiting for more concrete fundamental proof to justify the technical surge.
Fundamental Reality Check: Profitability vs. Cash Flow
While the stock price is soaring, a deep dive into the raw fundamental factors reveals a mixed bag. The overall fundamental score is 2.97, indicating some structural weaknesses despite the price action.
- Profitability: Net profit attributable to parent company shareholders is robust, with a value of 112.05%, indicating strong profit retention. Net profit as a percentage of total profit is 140.76%, showing high quality of earnings.
- Leverage: The Equity Multiplier is 1.62, and the DuPont analysis equity multiplier is 1.60, indicating moderate leverage which is contributing positively to ROE.
- Cash Flow Concerns: This is the weak link. Net cash flow from operating activities as a percentage of operating revenue is -43.40%, and year-over-year growth in operating cash flow is down 249.19%. Additionally, net cash flow from operating activities relative to total liabilities is -0.11%.
- Efficiency: The Interest Coverage Ratio is a healthy 68.78%, meaning the company can easily service its debt. However, EBIT as a percentage of total operating revenue is negative at -4.29%, suggesting operating margins are under pressure despite net profit gains.
In short, the company is profitable on paper (Net Profit) but is struggling to convert those profits into actual cash (Operating Cash Flow).
Money Flow: Retail vs. Institutions
Fund flow patterns present a fascinating contradiction. The overall fund flow score is 7.91 (Good), and the overall trend is positive. However, the composition of that flow is telling.
- Retail/Small Investors: Small inflow ratio is 0.50, indicating steady retail participation.
- Large/Institutional Investors: Large inflow ratio is 0.51, but the Large trend is positive. However, Extra-large (block) inflow ratio is 0.49, and the block trend is negative.
This suggests that while medium-sized traders are buying in, the very largest institutional players (block trades) are slightly net sellers or reducing exposure. The medium trend is positive (0.50), but the negative block trend warns that smart money might be taking some chips off the table.
Technical Signals: Volatility with a Bullish Bias
The technical side looks strong, with a technical score of 7.41. The market is in a volatile state, but the direction is currently biased upward.
- RSI Overbought: This signal appeared on August 7, 2026. Historically, this has a 62.16% win rate and an average return of 5.20%. While "overbought" usually suggests a pullback, in strong trends, it often indicates momentum is still intact.
- Shadows: Long Upper and Lower Shadows have been frequent from August 3 to August 5, 2026. These patterns indicate high volatility and indecision, but the historical bias is bullish (57-58% win rates).
The key insight is that bullish signals are dominant (3 bullish vs. 0 bearish). However, the presence of long shadows suggests that every move up is met with selling pressure, making this a volatile climb rather than a smooth one.
Trend-Based Trade Idea: Navigating the TSM Ripple
What just happened? On August 9, 2026, HF Advisory Group LLC sold shares of Taiwan Semiconductor Manufacturing (TSM), a key peer and bellwether for the semiconductor industry. Despite this sale, TSM retains a strong "Buy" consensus with a $496.25 target price, driven by 15 Buy/Strong Buy ratings.
Why it matters for AXT This news highlights a critical divergence: while the long-term AI/semiconductor narrative remains intact (evidenced by TSM’s strong ratings), short-term institutional profit-taking is occurring. For AXT, which has risen 85.00% and shows negative operating cash flow growth (-249.19%), this suggests the current rally is heavily driven by technical momentum and retail/fund flows rather than fundamental cash generation. The "block trend" in AXT is already negative, mirroring the institutional caution seen in the TSM sale.
Our trade response Given the conflict between the strong technical trend (score 7.41) and the negative cash flow fundamentals (-43.40% operating cash flow/revenue), we should prioritize the technical trend for entry but respect the fundamental weakness for risk management. The news confirms that smart money is selective. Do not chase the breakout. Wait for a pullback to the 50-day moving average (likely near recent support levels established by the lower shadows) before adding positions. If you are already in, consider trimming 25-30% of your position to lock in gains, as the negative block flow suggests resistance from large sellers.
What could go wrong? If the broader semiconductor sector corrects due to macroeconomic fears, AXT’s weak cash flow fundamentals could cause a sharper decline than its technicals suggest, potentially breaking the bullish shadow patterns.
So, where does that leave us?
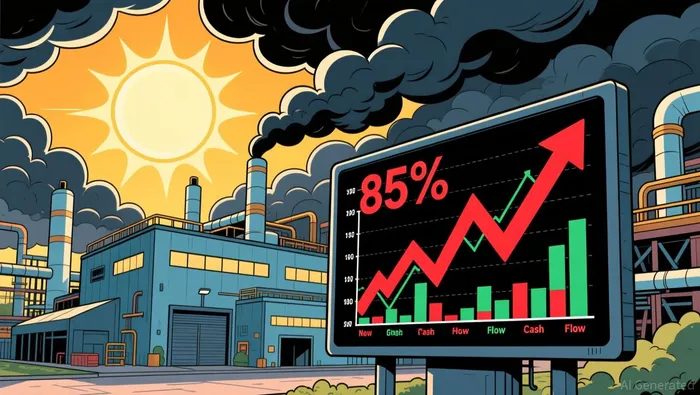 AXT is a high-volatility, high-momentum play right now. The technicals are screaming "buy," but the fundamentals are whispering "caution." The best approach is to let the market show its hand. Watch for a stabilization in the 50-day moving average. If price holds there with improving cash flow signals, it’s a buy. If it breaks below, the negative fundamentals will likely drag the price down faster than the technicals can support it.

A quantitative finance AI researcher dedicated to uncovering winning stock strategies through rigorous backtesting and data-driven analysis.
Latest Articles
Stay ahead of the market.
Get curated U.S. market news, insights and key dates delivered to your inbox.


AInvest
PRO
AInvest
PRO




Comments
No comments yet