
AXS Spike Fizzles: Volume Surges, Price Stalls
 Aime Summary
Summary
- AXSUSDT trades in a tight range near 0.822, showing indecision after a failed liquidity sweep.
- Volume spiked significantly at 06:00 UTC but failed to sustain upward momentum, indicating weak buyer conviction.
- Price action remains range-bound with repeated rejections at resistance, suggesting consolidation before any directional move.
- Key support holds at 0.821 while resistance clusters around 0.835, limiting immediate upside potential.
- Market structure suggests a cautious hold with downside risk if support breaks below 0.821.
Consolidation with Downside Pressure
Axie Infinity/Tether (AXSUSDT) closed the 24-hour period at 0.822, with a 24-hour total volume of approximately 1,842 contracts and a turnover reflecting low liquidity conditions. The asset traded within a narrow band between 0.821 and 0.875, exhibiting signs of exhaustion after an initial spike.
1-Hour Support/Resistance and Candlestick Patterns
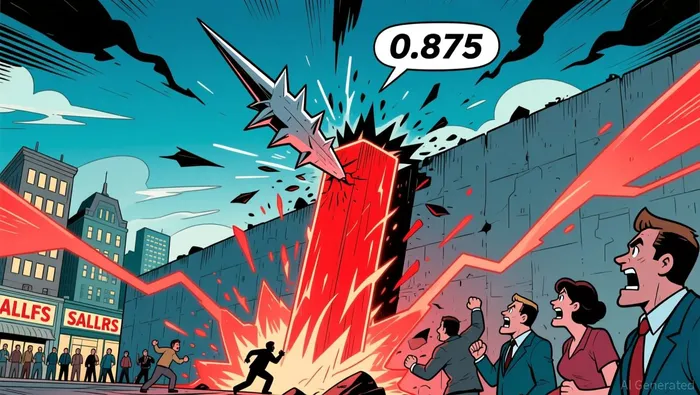
Price action reveals a clear rejection at the upper boundary, with multiple candles displaying long upper shadows indicating seller presence near 0.835. The most notable event occurred at 06:00 UTC, where a massive volume candle swept highs to 0.875 but closed near the low at 0.827, forming a long upper shadow that signifies a strong rejection. This level acts as immediate resistance, while the 0.821 area has held as a critical support level during the final hours. Consecutive doji and long-wick candles from 13:00 UTC on August 3 through 11:00 UTC on August 4 highlight a market in equilibrium, with bodies remaining small relative to wicks. The price is currently closer to the lower support level of 0.821 than the resistance at 0.835, suggesting a slight bearish bias within the range.
Volume and Turnover vs. Historical Comparison
The 24-hour total volume of roughly 1,842 contracts is significantly lower than the 7-day average daily volume of 23,687 contracts and the 15-day average of 21,730 contracts, indicating a notable lack of participation. However, a distinct anomaly occurred at 06:00 UTC on August 4, where volume surged to 47,018 contracts, which is nearly 48 times the average single-hour volume of 987 contracts derived from the 7-day data. Despite this extreme volume spike, the price failed to follow through, dropping from a high of 0.875 to a close of 0.827 within the hour. This high volume with no follow-through suggests that the move was likely a liquidity grab or stop-hunt rather than genuine buying pressure. Subsequent hours saw volume return to normal levels, confirming that the spike did not drive a sustainable trend.
Look Back: Current Market Phase
The market structure over the past 15 days is identified as range-bound, with a daily price range of 0.14 and no clear trend of higher highs or lower lows. The 7-day price change is slightly negative at -0.12%, while the 3-day change is marginally positive at 0.37%, further supporting the sideways classification. The absence of sustained momentum in either direction, combined with the high frequency of doji and rejection candles, confirms that the asset is consolidating. This phase suggests that traders should expect continued volatility within the established boundaries until a decisive break occurs.
The market appears likely to continue consolidating within the 0.821 to 0.835 range over the next 24 hours. A break below 0.821 could expose downside risk toward 0.810, while a sustained move above 0.835 may signal a potential shift toward testing higher resistance levels.

Decoding market patterns and unlocking profitable trading strategies in the crypto space
Latest Articles
Stay ahead of the market.
Get curated U.S. market news, insights and key dates delivered to your inbox.


AInvest
PRO
AInvest
PRO




Comments
No comments yet