
AXL Dips on Weak Volume, Buyers Absent
 Aime Summary
Summary
- AXLUSDT trades near short-term support at 0.036145 following a bearish engulfing pattern.
- 24-hour volume remains below the 7-day average, indicating weakening buyer conviction.
- Market structure shows lower lows, suggesting a continued short-term downtrend.
- Key resistance sits at 0.03688; a break above could signal mean reversion.
- Downside risk persists if price fails to hold the 0.03602 low.
Market Overview: Downtrend Continues
Axelar/Tether (AXLUSDT) is currently trading at 0.03682 on the latest 1-hour candle. Over the past 24 hours, the pair recorded a total volume of 152,563.45 USDT. The market exhibits signs of exhaustion with narrow ranges and declining volume participation.
1-Hour Support/Resistance and Candlestick Patterns
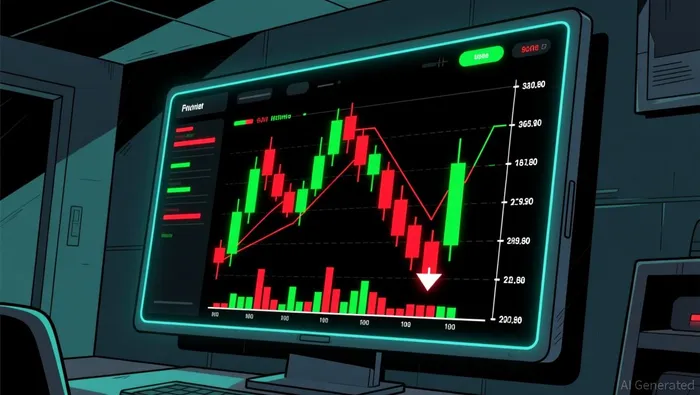
Price action over the last 24 hours has established a clear lower-low structure, with the most recent low recorded at 0.03602 during the 11:00 UTC hour. This level aligns with a historical support zone identified at 0.03604, creating a confluence area for potential buying interest. Resistance is firmly established at 0.03688, where the price rejected twice in the early part of the period. The proximity to support is currently tighter, as the price hovers just above the 0.03602 low. Candlestick analysis reveals a bearish engulfing pattern at 02:00 UTC, where the body of the subsequent candle fully covered the prior candle's body, signaling immediate selling pressure. Additionally, several candles exhibit long lower shadows, particularly at 18:00 UTC on August 3 and 09:00-10:00 UTC on August 4. These wicks are significantly longer than their respective bodies, indicating that buyers attempted to push prices higher but were rejected, resulting in narrow doji-like formations that suggest indecision rather than strong reversal momentum. The price appears closer to the support level of 0.03604 than to the resistance at 0.03688.
Volume and Turnover vs. Historical Comparison
The 24-hour total volume of approximately 152,563 USDT is notably lower than both the 7-day average daily volume of 263,192 USDT and the 15-day average of 231,553 USDT. This decline in volume suggests that the recent price drops are not being driven by massive institutional liquidation but rather by a lack of buyer interest. When examining hourly volume spikes, the highest activity occurred at 08:00 UTC with a volume of 24,110 USDT. This figure is roughly double the average single-hour volume of 10,966 USDT derived from the 7-day data. However, this spike did not result in a significant upward follow-through; instead, the price drifted lower to 0.03626 within the next few hours. Another notable volume event occurred at 20:00 UTC on August 3 with 16,252 USDT, which coincided with a drop to 0.03614. These instances of high volume with no sustained follow-through suggest that selling pressure absorbed the liquidity effectively. The volume anomalies do not appear to be driving a strong directional move, but rather confirming the weak market structure.
Look Back: Current Market Phase
Analyzing the market structure over the past 7 to 15 days reveals a clear downtrend. The market has been characterized by a series of lower highs and lower lows, with the 7-day price change showing a decline of approximately 1.49%. Although there was a slight 1.77% increase over the last 3 days, this is insufficient to reverse the broader downward trajectory. The price range over the last 15 days has been relatively tight, but the directional bias remains negative. The current phase is best described as a continuation of a downtrend, where the market is testing lower support levels. The presence of lower lows in the recent hourly data reinforces this classification. Traders should anticipate further downside pressure unless a decisive break above the immediate resistance at 0.03688 occurs.
Looking ahead, the next 24 hours could see continued consolidation or a further test of the 0.03602 low. An upside risk exists if price breaks and holds above 0.03688, potentially targeting 0.03700. Conversely, a break below 0.03602 could accelerate the downtrend toward the next major support at 0.03500.

Decoding market patterns and unlocking profitable trading strategies in the crypto space
Latest Articles
Stay ahead of the market.
Get curated U.S. market news, insights and key dates delivered to your inbox.


AInvest
PRO
AInvest
PRO




Comments
No comments yet