
Axelar’s Volume Spikes Fail to Break the Bearish Grind
 Aime Summary
Summary
- AXLUSDT trades near 0.03682, showing weak bullish momentum against a broader downtrend.
- Support at 0.03604 and resistance at 0.0373099 define a tight consolidation range.
- Volume spikes at 20:00 and 08:00 UTC failed to sustain directional price moves.
- Market structure remains bearish with lower lows, despite recent short-term consolidation.
- Next 24h outlook suggests caution; a break below 0.03604 risks further downside.
Weak Consolidation
Axelar/Tether (AXLUSDT) closed at 0.03682 in the latest hour. The asset recorded a 24-hour total volume of 137,237.44 USDT. Price action indicates a struggle to establish clear momentum within a narrow band.
1-Hour Support/Resistance and Candlestick Patterns
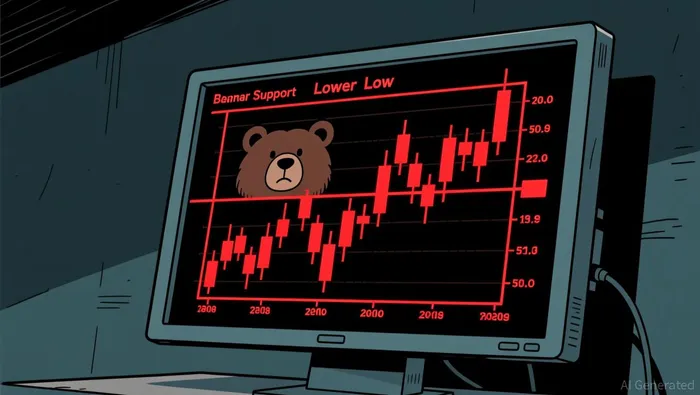
Price action exhibits a clear lower low structure, indicating bearish pressure over the recent period. The most significant resistance level identified is 0.0373099, where the price has struggled to break through, evidenced by rejections near this zone. On the downside, 0.03604 acts as a critical support level, having been tested multiple times with price bouncing slightly above it. The market structure suggests price is currently closer to the lower end of the recent range, hovering near support. Candlestick analysis reveals a bullish engulfing pattern at 06:00 UTC on August 4th, where the body fully covered the prior candle, signaling a temporary shift in momentum. However, this was followed by candles with long lower shadows at 09:00 and 10:00 UTC, indicating that buyers attempted to push prices up but faced immediate selling pressure, closing near the lows. These wicks suggest that rejection occurs rapidly whenever price attempts to move higher.
Volume and Turnover vs. Historical Comparison
The 24-hour total volume of 137,237.44 USDT is significantly lower than the 7-day average daily volume of 263,192.52 USDT and the 15-day average of 231,553.74 USDT. This indicates a lack of strong participation or interest in the current price movement. Examining hourly data, the volume spike at 20:00 UTC on August 3rd reached 16,252.16 USDT, which is approximately 1.5 times the 7-day average hourly volume of 10,966.35 USDT. Despite this spike, the price dropped from 0.03658 to 0.03614 in the following hours, showing that the volume did not drive a sustained upward move. Another notable volume event occurred at 08:00 UTC on August 4th with 24,110.27 USDT, yet the price only managed a marginal increase to 0.03626. These instances of high volume with no follow-through suggest that the selling pressure absorbed the buying interest, preventing any meaningful breakout. The volume anomalies did not effectively drive price in a bullish direction.
Look Back: Current Market Phase
The 7-day price change is -1.498%, and the 3-day change is +1.769%. However, the 15-day market structure feature is explicitly identified as lower low. The price has failed to maintain higher highs, and the recent 15-day daily price range is extremely narrow at 0.01, suggesting a period of consolidation within a broader downtrend. The current phase appears to be a sideways consolidation within a larger downtrend. The market is not showing signs of a strong uptrend or a sharp mean reversion from a large prior move. Instead, it is grinding lower with intermittent periods of low-volume consolidation. This structure suggests that the bearish trend remains dominant, and any upward moves are likely to be met with selling pressure until a clear break of structure occurs.
Looking ahead, the next 24 hours will likely see continued consolidation or a test of lower levels. If the price breaks below the 0.03604 support, further downside could follow. Conversely, a sustained move above 0.0373099 with high volume would be required to signal a potential trend reversal.

Decoding market patterns and unlocking profitable trading strategies in the crypto space
Latest Articles
Stay ahead of the market.
Get curated U.S. market news, insights and key dates delivered to your inbox.


AInvest
PRO
AInvest
PRO




Comments
No comments yet