
AVNT Volume Spikes, But Selling Pressure Drives Price Down
 Aime Summary
Summary
- AVNTUSDT trades near key support at 0.0795, showing bearish momentum.
- 24h volume significantly exceeds 7-day average, indicating high selling pressure.
- Market structure exhibits lower highs and lows, confirming a downtrend.
- Repeated rejection at 0.0810 resistance suggests limited immediate upside.
- A break below 0.0795 could trigger further downside acceleration.
Market Overview: Bearish Momentum
Avantis/Tether (AVNTUSDT) currently trades around 0.08027 following a 24-hour period characterized by elevated turnover. The asset has registered a total volume of approximately 158,000 units, reflecting intensified market activity compared to recent averages.
1-Hour Support/Resistance and Candlestick Patterns
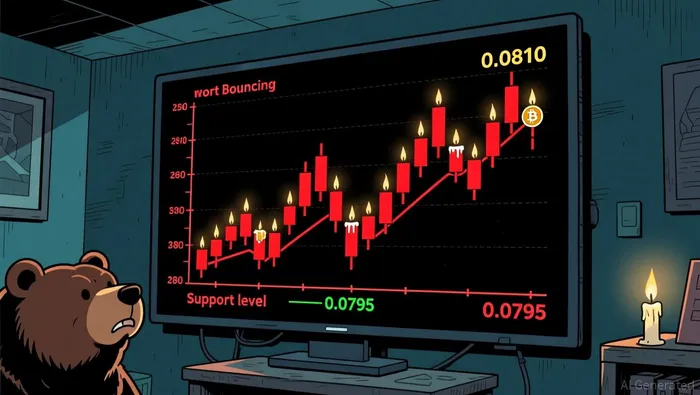
Price action has repeatedly tested the 0.0810–0.0811 zone, resulting in multiple rejections marked by long upper shadows and bearish engulfing patterns, particularly evident during the 14:00 and 05:00 UTC candles. These formations indicate that sellers are actively defending this resistance level, preventing sustained upward movement. Conversely, the 0.0795–0.0798 area has acted as a temporary support base, with the price finding bids near 0.07952 during the 18:00 UTC candle on August 3. However, the presence of consecutive bearish engulfing candles and long lower wicks suggests that support is fragile and buyers are struggling to maintain control. The current price of 0.08027 sits closer to the immediate support cluster than the robust resistance ceiling, leaving the asset vulnerable to further downside if the 0.0795 level fails to hold.
Volume and Turnover vs. Historical Comparison
The 24-hour trading volume of roughly 158,000 units substantially exceeds the 7-day average hourly volume of approximately 7,707 units, highlighting a significant spike in market participation. Notable volume anomalies occurred during the 18:00 UTC candle on August 3, which recorded a volume of 78,366 units, and the 06:00 UTC candle on August 4, which saw 16,775 units. Despite these high-volume events, price follow-through was weak; the 18:00 UTC spike resulted in a modest decline, and subsequent hours showed limited recovery, indicating that selling pressure absorbed the buying interest effectively. This pattern of high volume with minimal price appreciation suggests distribution rather than accumulation, implying that the volume anomalies did not drive a sustainable price increase but rather exacerbated the downward drift.
Look Back: Current Market Phase
The broader market structure over the past 7 to 15 days clearly defines a downtrend, characterized by a series of lower highs and lower lows. The 7-day price change of approximately -3.88% and the 3-day change of -0.21% further corroborate this bearish trajectory. The price has failed to establish higher lows, instead making new lows near 0.0795, which confirms that the market is in a corrective phase rather than a sideways consolidation. This structural weakness suggests that the current price action is part of a larger downward move, with any rallies likely to be met with selling pressure until a clear higher low is established.
The next 24 hours could see continued pressure if the 0.0795 support breaks, potentially exposing lower levels around 0.0790. Conversely, a decisive break above 0.0810 resistance would be required to mitigate downside risk and signal a potential shift in momentum.

Decoding market patterns and unlocking profitable trading strategies in the crypto space
Latest Articles
Stay ahead of the market.
Get curated U.S. market news, insights and key dates delivered to your inbox.


AInvest
PRO
AInvest
PRO




Comments
No comments yet