
AVAX Volume Surges, But Price Stalls at Resistance
 Aime Summary
Summary
- AVAXUSDC trades near 6.81 USDC within a tight range bound structure.
- 24-hour volume significantly exceeds historical averages, indicating elevated market activity.
- Price action shows repeated rejections at key resistance levels above 6.90 USDC.
- Recent candlesticks feature long wicks, suggesting indecision and potential reversal zones.
- Market appears to be consolidating after a short-term upward momentum phase.
Range Consolidation with High Volume
Avalanche/USDC (AVAXUSDC) closed the latest 1-hour candle at 6.81 USDC, with a high of 6.813 and a low of 6.796. Over the past 24 hours, the asset recorded a total volume of approximately 2,300 units, reflecting substantial turnover activity amidst current price levels.
1-Hour Support/Resistance and Candlestick Patterns
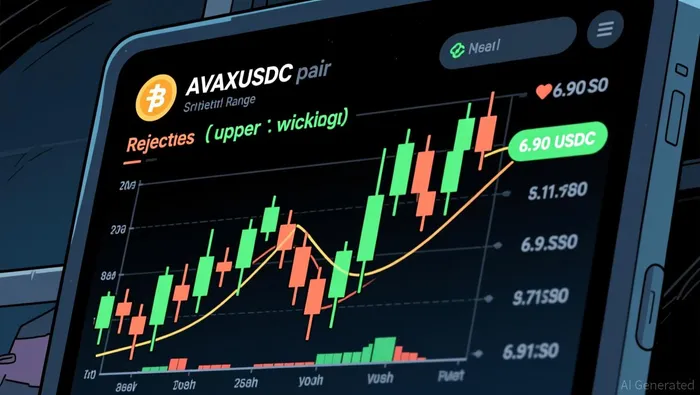
The current price structure identifies 6.962 USDC as a critical immediate resistance level, marked by a clear price rejection on August 3rd at 22:00 where the price failed to sustain above this high. Another notable resistance zone exists around 6.604 USDC, observed as a local high earlier in the period. On the downside, 6.754 USDC acts as a near-term support floor, tested during the early hours of August 4th. The candlestick analysis reveals significant indecision; specifically, the hour ending at 21:00 on August 3rd displayed a long upper shadow, indicating strong selling pressure after a sharp intraday rally. Similarly, the 01:00 candle on August 4th showed a long upper shadow, suggesting that buyers could not maintain control above the 6.90 USDC area. The price is currently positioned closer to the mid-range of its recent 24-hour trading band, with immediate support at 6.773 USDC and resistance at 6.962 USDC.
Volume and Turnover vs. Historical Comparison
The 24-hour total volume of roughly 2,300 units is markedly higher than the 15-day average daily volume of 1,191.93 and the 7-day average of 1,262.38. When examining hourly granularity, the average 1-hour volume over the past 7 days is approximately 52.6 units. Several hours witnessed volume spikes exceeding twice this average, most notably the 03:00 candle on August 4th with a volume of 583.75 units, followed by the 01:00 candle with 324.62 units. These spikes occurred during periods of price volatility, specifically around the 6.80–6.90 USDC range. However, the subsequent price action did not show a sustained directional breakout following these high-volume events. For instance, after the massive volume spike at 03:00, the price drifted lower to 6.763 by 04:00. This suggests that while volume anomalies were present, they did not effectively drive a persistent trend, indicating potential distribution or absorption of liquidity rather than strong directional conviction.
Look Back: Current Market Phase
Analyzing the 15-day structure, the market exhibits a range-bound phase. The 15-day daily price range is recorded at 0.95, which implies limited volatility expansion relative to the price levels. Although the asset posted a 3-day price change of approximately 6.55% and a 7-day change of 5.10%, the recent price action has failed to establish a clear sequence of higher highs and higher lows necessary for a confirmed uptrend. Instead, the price has repeatedly tested upper boundaries only to pull back, creating a consolidation pattern. The market structure feature explicitly identified as range bound aligns with the observation that price is oscillating within a defined corridor rather than trending decisively in one direction. This suggests that the recent upward move may be undergoing a mean reversion or consolidation process within the broader sideways structure.
Looking ahead, the next 24 hours may see continued consolidation unless volume sustains above recent spikes to break the 6.96 USDC resistance. A break below 6.75 USDC could expose further downside risk toward the 6.70 level, while a sustained move above 6.96 USDC might signal a shift toward a more bullish phase.

Decoding market patterns and unlocking profitable trading strategies in the crypto space
Latest Articles
Stay ahead of the market.
Get curated U.S. market news, insights and key dates delivered to your inbox.


AInvest
PRO
AInvest
PRO




Comments
No comments yet