
Avalon Labs Spike Fizzles: Why High Volume Failed to Break Resistance
 Aime Summary
Summary
- Avalon Labs/Tether price surged to 0.02147 before reversing sharply to 0.02071.
- Volume spiked massively at 11:00, driving a rapid 7.5% intraday move.
- Market structure remains bearish with lower lows dominating the recent 15-day range.
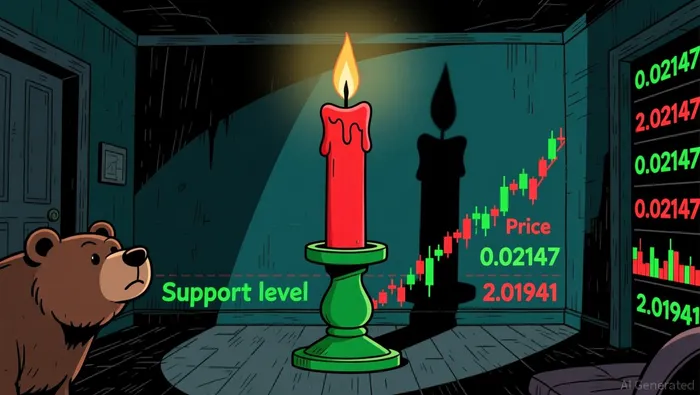
- 0.01941 acts as immediate support following the rejection at 0.02041.
- Upside resistance is located near 0.02147, where heavy selling pressure emerged.
Intraday Volatility Spike
Avalon Labs/Tether (AVLUSDT) closed at 0.02071 on the latest 1-hour candle, following a volatile session where price touched a high of 0.02319 and a low of 0.01941. Total 24-hour volume reached approximately 7.8 million, significantly exceeding recent averages, indicating intense participation and potential liquidity shifts during the price discovery phase.
1-Hour Support/Resistance and Candlestick Patterns
Price action reveals a clear struggle between buyers and sellers around the 0.0194–0.0204 range. The hour ending at 03:00 produced a bearish engulfing candle, confirming rejection at higher levels after an initial spike. This was followed by a long lower shadow at 06:00, suggesting temporary buyer interest at 0.01941, which now acts as a critical short-term support level. Resistance is firmly established near 0.02041, where the price failed to hold gains during the 03:00 hour, and more notably at 0.02147, the peak reached during the volume surge. The current price of 0.02071 sits closer to the immediate support zone than the strong overhead resistance, indicating that sellers are currently in control of the local structure. The presence of doji candles at 08:00 suggests indecision, but the overall pattern of long upper shadows indicates persistent selling pressure at higher prices.
Volume and Turnover vs. Historical Comparison
The 24-hour total volume of roughly 7.8 million is substantially higher than the 7-day average daily volume of 5.3 million and the 15-day average of 7.7 million, highlighting an anomalous increase in trading activity. Specifically, the hours at 11:00 and 12:00 recorded volumes of 1.78 million each, which are approximately 8 times the 7-day average single-hour volume of 221,374. Despite this massive volume injection, the price failed to sustain the breakout, closing lower at 0.02071 from the 0.02147 open of that hour. This high-volume rejection suggests that the buying pressure was absorbed by strong sell orders, indicating a potential distribution phase or a liquidity trap. The volume spike did not drive effective follow-through, as price dropped 3.5% in the subsequent hour, signaling that the volume anomaly was not supported by genuine bullish momentum.
Look Back: Current Market Phase
The broader market structure over the last 7 to 15 days is characterized by lower lows, as indicated by the market structure feature. While there was a slight positive 3-day change of 8.6%, the 7-day change remains negative at -0.05%, and the 15-day daily price range is extremely tight at 0.01, suggesting a period of consolidation or low-volatility compression. However, the recent sharp move and subsequent rejection align more closely with a mean reversion scenario following a prior move, or a continuation of a downtrend if the lower high at 0.02147 holds. The market appears to be in a consolidation phase within a broader downtrend, where sharp rallies are met with immediate selling pressure, preventing a structural shift to an uptrend.
The next 24 hours will likely see price testing the 0.01941 support level again. If this support breaks, downside risk increases toward 0.01855, while a sustained hold above 0.02041 could signal a potential retest of the 0.02147 resistance.

Decoding market patterns and unlocking profitable trading strategies in the crypto space
Latest Articles
Stay ahead of the market.
Get curated U.S. market news, insights and key dates delivered to your inbox.


AInvest
PRO
AInvest
PRO




Comments
No comments yet