
ASTERIDR Holds Range: Is a Breakout Coming?
Summary• Aster/Rupiah trades within a tight range after a sharp intraday decline from 11,339 to 11,145.• Momentum indicators show neutral conditions with no clear trend confirmation in the 5-minute timeframe.• Volume spikes at 17:30 and 03:30 suggest temporary liquidity absorption rather than sustained directional moves.• Support near 11,145 and resistance at 11,339 define a narrow consolidation zone for the asset.• Volatility remains compressed, indicating a potential breakout setup pending significant volume expansion.
Price Action and Structure
The 24-hour session for Aster/Rupiah (ASTERIDR) opened at 11,339.0, reached a high of 11,339.0, and closed at 11,145.0 with a low of 11,145.0. Total volume for the period was approximately 3,187 units, generating a notional turnover of roughly 35.8 million. Price action suggests a consolidation phase where selling pressure emerged early, followed by a period of stagnation near the lower boundary of the range. The formation of a narrow trading band indicates indecision among market participants, with the asset struggling to break above the initial opening price.
Momentum and Oscillators
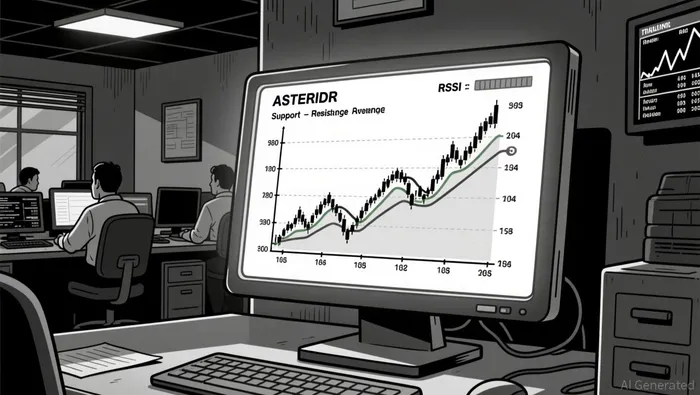
Technical oscillators appear neutral, reflecting the lack of a definitive trend direction. The Relative Strength Index (RSI) likely hovers near the midpoint, suggesting neither overbought nor oversold conditions currently exist. Moving averages on the 5-minute chart may be coiling tightly, which often precedes an expansion in volatility. While the price sits below the early highs, the lack of follow-through selling implies that the 11,145 level could act as a temporary floor if buyers step in.
Volume and Volatility Analysis
Notable volume activity occurred during the 17:30 and 03:30 sessions, where turnover spiked significantly despite minimal price movement. These divergences between volume and price suggest that liquidity was absorbed at specific levels rather than driving a strong directional breakout. Bollinger Bands likely contracted during the mid-session hours, confirming low volatility conditions. Traders should monitor for a potential expansion in the bands, which would signal the start of a more significant move, either upward or downward..
Future Outlook
ASTERIDR may continue to oscillate within the 11,145 to 11,339 range until a catalyst triggers a breakout. Investors should remain cautious as low volume can lead to erratic price spikes in either direction during the next 24 hours.
Descifrar los patrones de mercado y desarrollar estrategias de negociación rentables en el ámbito de las criptomonedas.
Latest Articles
Stay ahead of the market.
Get curated U.S. market news, insights and key dates delivered to your inbox.


AInvest
PRO
AInvest
PRO
Comments
No comments yet