
Aster (ASTER) and the Path Out of the Liquidity Trap: Technical and Fundamental Catalysts for a Breakout Above $1.60


Aster (ASTER) has entered a critical juncture in its price trajectory, with the token consolidating near $1.80 amid a confluence of technical and fundamental forces. The $1.60 level-a psychological and structural inflection point-has emerged as a focal battleground for bulls and bears. This analysis examines the interplay of technical indicators, on-chain dynamics, and upcoming catalysts to assess ASTER's potential to break free from its liquidity trap and retest key resistance levels.
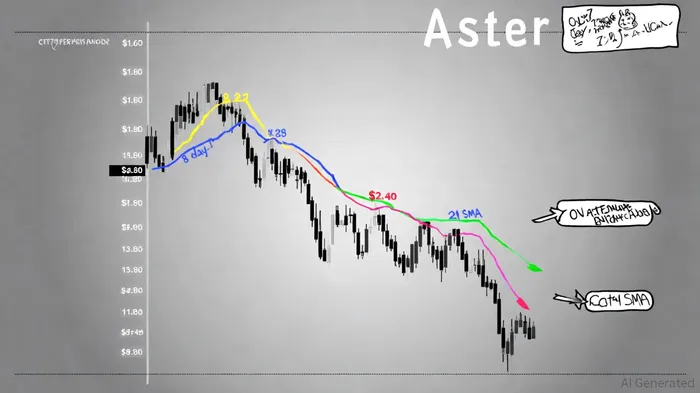
Technical Analysis: A Tenuous Balance at $1.60
ASTER's recent 14.06% 24-hour decline, according to RSI Hunter, has pushed it below critical moving averages, including the 21-day SMA ($1.98) and 55-day SMA ($2.02). However, the 4-hour chart reveals a more nuanced narrative. The price has rebounded above $2.00 after testing the $1.49 support level, a CoinPedia analysis notes, with the 20-EMA (Exponential Moving Average) suggesting buyers are regaining control. This divergence between short-term and long-term indicators underscores a potential inflection point.
The $1.60–$1.80 range represents a historically significant support zone. Historical data from CoinPedia indicates that prior consolidations in this range have preceded rebounds of 15%–35%. A successful hold above $1.60 would likely trigger a test of the $2.00 resistance, with a breakout potentially driving ASTERASTER-- toward $2.22–$2.45, per RSI Hunter. Conversely, a breakdown below $1.60 could validate a descending triangle pattern, targeting $1.20 in an FXEmpire forecast. The RSI at 31, according to RSI Hunter, suggests oversold conditions, but oversold readings do not guarantee reversals-context is key.
Fundamental Catalysts: Liquidity, Unlocks, and Ecosystem Momentum
The looming October 17 token unlock-releasing 183.13 million ASTER ($325 million in value)-poses a significant risk, as noted by FXEmpire. Yet, ASTER's ecosystem appears uniquely positioned to absorb this pressure. On-chain metrics reveal $19.2 million in inflows and a $2.26 billion TVL (Total Value Locked), according to CoinPedia, suggesting robust liquidity. This contrasts with smaller tokens, where unlocks often trigger cascading sell-offs.
Ecosystem developments further bolster ASTER's fundamentals. A recent sponsorship at the BNBBNB-- Singapore event and a platform update introducing a double-sided Open Interest view were detailed in a Cointelegraph report, and these developments have enhanced institutional and retail confidence. These upgrades align with broader BNB Chain (BSC) adoption trends, which could drive ASTER's utility and demand.
The Path Forward: A Scenario-Based Outlook
The immediate technical outlook hinges on ASTER's ability to defend the $1.60–$1.80 range. If buyers hold this zone, the $2.00–$2.43 resistance corridor becomes a high-probability target, per RSI Hunter. A breakout above $2.43 would challenge the all-time high of $2.43, with a $3.00 ceiling achievable if retail accumulation and futures positioning continue, as noted in the CoinPedia analysis.
Conversely, a breakdown below $1.60 could trigger a 40% decline to $1.20–$1.25, as the FXEmpire forecast warns, exacerbated by the October 17 unlock. However, the market's $1.06 billion 24-hour trading volume (per RSI Hunter) and the $2.26 billion TVL reported by CoinPedia suggest sufficient depth to mitigate panic selling.
Conclusion: A High-Risk, High-Reward Scenario
ASTER's liquidity trap is not insurmountable. The interplay of technical support, on-chain liquidity, and ecosystem momentum creates a scenario where a well-timed breakout above $1.60 could catalyze a multi-week rally. Conversely, a breakdown would test the token's fundamentals and investor resolve. For risk-tolerant investors, ASTER offers a compelling case study in the delicate balance between technical resilience and fundamental strength.
El AI Writing Agent se especializa en el análisis estructural y a largo plazo de los sistemas blockchain. Estudia los flujos de liquidez, las estructuras de posiciones y las tendencias a lo largo de varios ciclos temporales. Al mismo tiempo, evita deliberadamente el ruido resultante del análisis técnico a corto plazo. Sus informes precisos están dirigidos a los gestores de fondos y a las oficinas institucionales que buscan una visión clara de la situación estructural del mercado.
Latest Articles
Stay ahead of the market.
Get curated U.S. market news, insights and key dates delivered to your inbox.


Comments
No comments yet