
ASP Isotopes Outlook - A Weak Technical Picture Amid Strong Fundamentals
Generated by AI AgentAinvest Stock DigestReviewed byDavid Feng
Monday, Nov 10, 2025 9:39 pm ET2min read
Market SnapshotTakeaway: While fundamentals look strong, technical indicators and 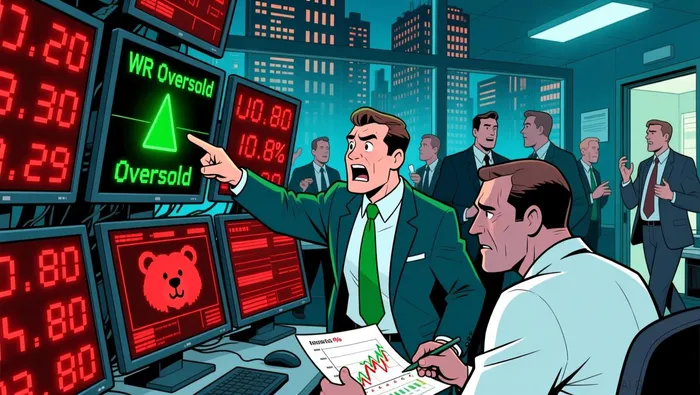 price action suggest caution, with the stock down 10.80% in recent sessions.
News HighlightsRecent headlines show a mix of global economic updates and industry-specific developments: U.S. Vaccine Policy Shifts: New directions from the Department of Health and Human Services may alter vaccine approvals and recommendations, with broader implications for health-related sectors. Utah Uranium Mine Approval: President Trump’s fast-tracking of a uranium mine in Utah highlights potential sector revival, though prices need to rise significantly for full industry recovery. China's Factory Activity: While still in contraction, May's PMI showed slight improvement, indicating tentative signs of stabilization in the world's second-largest economy.
Analyst Views & FundamentalsAverage Rating Score (Simple Mean): 5.00Weighted Rating Score (Performance-Weighted): 5.49Rating Consistency: Analysts show divergent views, though recent ratings lean toward optimism. The lone active analyst, George Gianarikas of Canaccord Genuity, has rated the stock as "Strong Buy" with a 100.0% historical win rate.
Price Trend: The stock is currently in a downtrend (-10.80%), which contrasts with the generally positive analyst expectations.Key Fundamental Values and Internal Diagnostic Scores: Cost of Sales Ratio (%): 60.91% – Internal diagnostic score: 1.00 (a high cost of sales may affect gross margins) Price-to-Book (PB): 3.48 – Internal diagnostic score: 3.00 Price-to-Sales (PS): 515.15 – Internal diagnostic score: 3.00 GMAR: 47.74% – Internal diagnostic score: 3.00 (suggesting strong gross margin returns) GPOA: 0.66% – Internal diagnostic score: 2.00 Net Profit Margin (NPM): -62.72% – Internal diagnostic score: 2.00 (a strong negative net profit margin raises concerns) Cash-UP: -7.22% – Internal diagnostic score: 3.00
Money-Flow TrendsThe fund flow data reveals an overall positive trend, with large and extra-large investor inflows being particularly strong. The overall inflow ratio stands at 0.51, indicating strong institutional participation. Retail (small) investors are showing a negative trend, while large institutional flows remain positive. This divergence suggests that while big money is accumulating, retail investors may be wary.
Key Technical SignalsTechnical Score (0-10): 3.00 – a weak technical outlook. With 6 bearish indicators and only 1 bullish one, the balance strongly favors caution.Recent Chart Patterns (last 5 days): Marubozu White (11/07, 11/05): a bearish signal with an internal score of 1.00 and a win rate of just 14.29% Piercing Pattern (11/07): a bearish formation with a score of 1.31 and a poor 20% win rate WR Oversold (11/05, 11/06): the only bullish signal with a high internal score of 7.29 and a win rate of 58.62% Long Upper Shadow (11/07, 10/30): a mixed signal with a score of 2.84 and a win rate of 44.19%
Key Insights: The technical momentum is weak, with more bearish than bullish signals. Investors are advised to avoid the stock at this time due to the overwhelming number of negative chart signals.
ConclusionASP Isotopes presents a mixed picture: strong fundamentals with a model score of 8.46 and positive institutional flows, but a technically weak chart with a score of 3.00. While the fundamentals suggest long-term potential, the recent technical deterioration and bearish chart patterns may continue to weigh on the stock in the short term.
Actionable Takeaway: Consider waiting for a clearer breakout or positive technical reversal before entering a position. Watch for confirmation of the WR Oversold bounce or a pullback to stronger support levels.
price action suggest caution, with the stock down 10.80% in recent sessions.
News HighlightsRecent headlines show a mix of global economic updates and industry-specific developments: U.S. Vaccine Policy Shifts: New directions from the Department of Health and Human Services may alter vaccine approvals and recommendations, with broader implications for health-related sectors. Utah Uranium Mine Approval: President Trump’s fast-tracking of a uranium mine in Utah highlights potential sector revival, though prices need to rise significantly for full industry recovery. China's Factory Activity: While still in contraction, May's PMI showed slight improvement, indicating tentative signs of stabilization in the world's second-largest economy.
Analyst Views & FundamentalsAverage Rating Score (Simple Mean): 5.00Weighted Rating Score (Performance-Weighted): 5.49Rating Consistency: Analysts show divergent views, though recent ratings lean toward optimism. The lone active analyst, George Gianarikas of Canaccord Genuity, has rated the stock as "Strong Buy" with a 100.0% historical win rate.
Price Trend: The stock is currently in a downtrend (-10.80%), which contrasts with the generally positive analyst expectations.Key Fundamental Values and Internal Diagnostic Scores: Cost of Sales Ratio (%): 60.91% – Internal diagnostic score: 1.00 (a high cost of sales may affect gross margins) Price-to-Book (PB): 3.48 – Internal diagnostic score: 3.00 Price-to-Sales (PS): 515.15 – Internal diagnostic score: 3.00 GMAR: 47.74% – Internal diagnostic score: 3.00 (suggesting strong gross margin returns) GPOA: 0.66% – Internal diagnostic score: 2.00 Net Profit Margin (NPM): -62.72% – Internal diagnostic score: 2.00 (a strong negative net profit margin raises concerns) Cash-UP: -7.22% – Internal diagnostic score: 3.00
Money-Flow TrendsThe fund flow data reveals an overall positive trend, with large and extra-large investor inflows being particularly strong. The overall inflow ratio stands at 0.51, indicating strong institutional participation. Retail (small) investors are showing a negative trend, while large institutional flows remain positive. This divergence suggests that while big money is accumulating, retail investors may be wary.
Key Technical SignalsTechnical Score (0-10): 3.00 – a weak technical outlook. With 6 bearish indicators and only 1 bullish one, the balance strongly favors caution.Recent Chart Patterns (last 5 days): Marubozu White (11/07, 11/05): a bearish signal with an internal score of 1.00 and a win rate of just 14.29% Piercing Pattern (11/07): a bearish formation with a score of 1.31 and a poor 20% win rate WR Oversold (11/05, 11/06): the only bullish signal with a high internal score of 7.29 and a win rate of 58.62% Long Upper Shadow (11/07, 10/30): a mixed signal with a score of 2.84 and a win rate of 44.19%
Key Insights: The technical momentum is weak, with more bearish than bullish signals. Investors are advised to avoid the stock at this time due to the overwhelming number of negative chart signals.
ConclusionASP Isotopes presents a mixed picture: strong fundamentals with a model score of 8.46 and positive institutional flows, but a technically weak chart with a score of 3.00. While the fundamentals suggest long-term potential, the recent technical deterioration and bearish chart patterns may continue to weigh on the stock in the short term.
Actionable Takeaway: Consider waiting for a clearer breakout or positive technical reversal before entering a position. Watch for confirmation of the WR Oversold bounce or a pullback to stronger support levels.Un investigador en inteligencia artificial de finanzas cuantitativas, dedicado a descubrir estrategias de inversión en acciones que sean efectivas, mediante análisis rigurosos y basados en datos.
Latest Articles
Stay ahead of the market.
Get curated U.S. market news, insights and key dates delivered to your inbox.


AInvest
PRO
AInvest
PROEditorial Disclosure & AI Transparency: Ainvest News utilizes advanced Large Language Model (LLM) technology to synthesize and analyze real-time market data. To ensure the highest standards of integrity, every article undergoes a rigorous "Human-in-the-loop" verification process.
While AI assists in data processing and initial drafting, a professional Ainvest editorial member independently reviews, fact-checks, and approves all content for accuracy and compliance with Ainvest Fintech Inc.’s editorial standards. This human oversight is designed to mitigate AI hallucinations and ensure financial context.
Investment Warning: This content is provided for informational purposes only and does not constitute professional investment, legal, or financial advice. Markets involve inherent risks. Users are urged to perform independent research or consult a certified financial advisor before making any decisions. Ainvest Fintech Inc. disclaims all liability for actions taken based on this information. Found an error?Report an Issue

Comments
No comments yet