
Arweave Volume Spike Fizzles — Buyers Hit Resistance
 Aime Summary
Summary
- Price consolidates near 1.827 after a 24-hour range bound.
- Key resistance at 1.863 tests buying exhaustion.
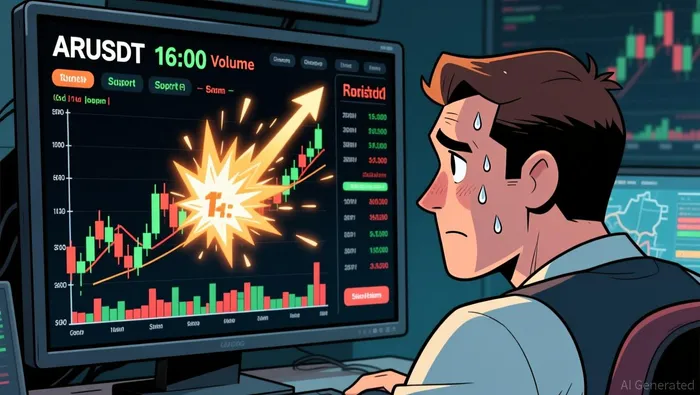
- Volume spike at 16:00 failed to sustain upward momentum.
- Support holds firmly at 1.818 during Asian session.
- Market structure remains neutral with limited directional conviction.
Market Overview: Consolidation Near Support
Arweave/Tether (ARUSDT) trades at 1.827 with a 24-hour volume of 23,954. The asset maintains a tight range following a significant intraday volume spike.
1-Hour Support/Resistance and Candlestick Patterns
Price action reveals a defined range with clear rejection levels. Resistance is established at 1.863 where a volume spike occurred, and again at 1.848 where long upper shadows appeared. Support is confirmed at 1.818 and 1.824 where price found buyers. The 16:00 candle shows a bullish engulfing pattern with high volume, but the subsequent hours failed to break higher, suggesting selling pressure absorbed the buying interest. Price is currently closer to the 1.818 support level than the 1.863 resistance.
Volume and Turnover vs. Historical Comparison
The 24-hour total volume of 23,954 is slightly below the 15-day average daily volume of 12,510 but higher than the 7-day average of 14,687, indicating increased relative activity. The hour ending at 16:00 recorded a volume of 6,400, which is significantly higher than the 7-day average single-hour volume of 612. This spike coincided with a price increase to 1.862. However, the subsequent three hours showed declining volume and price reversal, indicating that the volume anomaly did not drive effective follow-through buying. The lack of sustained high volume suggests the move was likely a liquidity grab rather than a trend initiation.
Look Back: Current Market Phase
The market structure over the last 15 days is range bound. The 15-day daily price range is 0.26, which is relatively tight. The 3-day change is slightly negative at -0.16%, while the 7-day change is positive at 5.73%. This indicates a recent upward move that has now stalled. The price is oscillating between established support and resistance levels without making new higher highs or lower lows. This behavior suggests a consolidation phase within a broader sideways market.
The next 24 hours may see continued consolidation near 1.827. A break below 1.818 could lead to downside risk toward 1.806. Conversely, a sustained break above 1.863 may signal a resumption of the uptrend toward 1.90.

Decoding market patterns and unlocking profitable trading strategies in the crypto space
Latest Articles
Stay ahead of the market.
Get curated U.S. market news, insights and key dates delivered to your inbox.


AInvest
PRO
AInvest
PRO




Comments
No comments yet