
Arweave Rebounds from Resistance, But Volume Fails to Follow
 Aime Summary
Summary
- Arweave trades near key resistance levels with mixed volume signals over the past 24 hours.
- Price action shows rejection at higher highs, suggesting potential consolidation or pullback in the short term.
- Recent volume spikes did not sustain upward momentum, indicating cautious buyer interest at current levels.
- Market structure remains range-bound, requiring careful observation of support and resistance breaks for direction.
- Traders should monitor for breakouts or breakdowns to confirm the next significant price movement phase.
Range-Bound Consolidation
Arweave (AR/USDT) closed the latest one-hour candle at 1.811, following a 24-hour trading session with a total volume of approximately 6,248.76 USDT. The asset has exhibited constrained price action within a defined range, reflecting a balance between buyer and seller activity without a decisive directional bias.
1-Hour Support/Resistance and Candlestick Patterns
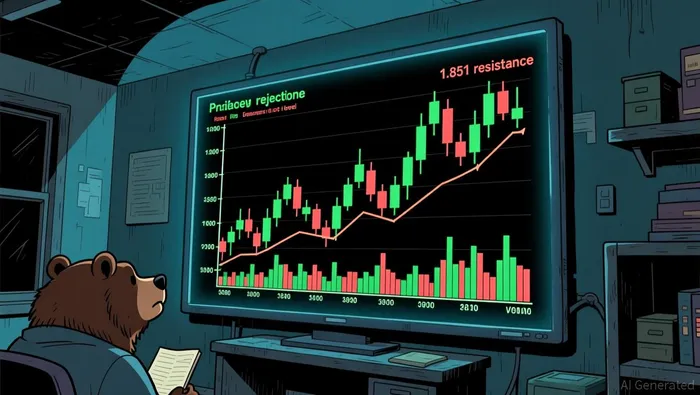
The price action over the last 24 hours highlights a clear struggle between support and resistance levels. The upper boundary around 1.851 acted as a significant resistance point, evidenced by the rejection seen in the candle at 04:00 on August 4, where the price failed to sustain above this level after an initial spike. Conversely, support has been tested near the 1.806 area, with multiple candles showing lows touching or nearing this threshold before recovering slightly. The candlestick patterns provide additional context to this structure; specifically, a bearish engulfing pattern was identified at 04:00 on August 4, where the closing price was significantly lower than the opening, covering the previous candle's body. This pattern, combined with the rejection at resistance, suggests that selling pressure may be gaining traction. Additionally, a long lower shadow was noted in the candle at 01:00 on August 4, indicating that buyers attempted to push the price up but were met with resistance, resulting in a wick that was notably longer than the body. This suggests that while there is some underlying support, it is not strong enough to maintain higher prices against the prevailing selling pressure. The price is currently closer to the support level, having retreated from the recent high, which could indicate a potential shift in momentum towards the downside if support fails to hold.
Volume and Turnover vs. Historical Comparison
Analyzing the volume data reveals interesting dynamics when compared to historical averages. The 24-hour total volume of approximately 6,248.76 USDT is relatively low compared to the 7-day average daily volume of 13,769.93 USDT and the 15-day average of 12,834.58 USDT. This indicates a significant decrease in trading activity over the past day. Looking at hourly volumes, the highest spike occurred at 04:00 on August 4, with a volume of 1,448.98 USDT. While this is a notable spike, it is not exceptionally high compared to the 7-day average single-hour volume of 573.75 USDT, representing roughly 2.5 times the average. However, despite this volume increase, the price did not follow through with a sustained move higher, instead closing lower at 1.834 from an open of 1.851. This divergence between volume and price movement suggests that the volume spike did not effectively drive the price, possibly indicating distribution or a lack of strong buyer conviction. Other hours with moderate volume increases, such as at 02:00 and 03:00 on August 4, also failed to produce significant price advances, reinforcing the notion that the current volume anomalies are not driving a strong directional trend. The lack of follow-through after volume spikes implies that the market is not responding strongly to the current trading activity, which could lead to continued consolidation or a potential breakdown if selling pressure increases.
Look Back: Current Market Phase
Examining the market structure over the past 7 to 15 days provides insight into the current phase. The price has shown a recent upward movement, with a 3-day change of approximately 4.20% and a 7-day change of roughly 4.92%. However, the price action has not consistently formed higher highs and higher lows, which would be indicative of a strong uptrend. Instead, the price has been moving within a relatively confined range, with the 15-day daily price range being only 0.26. This limited range, combined with the lack of a clear directional trend, suggests that the market is currently in a sideways or range-bound phase. The recent price increase appears to be part of a mean reversion from a prior move, rather than the start of a new sustained uptrend. The market is likely consolidating after the recent gains, with participants waiting for a clearer signal to determine the next significant price direction. This phase is characterized by indecision and a balance between buying and selling pressure, which could lead to a breakout or breakdown depending on external factors or internal momentum shifts. The current structure suggests that traders should be cautious and look for confirmation of a trend before making significant positions.
The market appears to be in a consolidation phase, with potential for a breakout or breakdown in the next 24 hours. A break above 1.851 could signal a resumption of the upward trend, while a drop below 1.806 may indicate further downside risk. Traders should monitor these key levels for confirmation of the next market direction.

Decoding market patterns and unlocking profitable trading strategies in the crypto space
Latest Articles
Stay ahead of the market.
Get curated U.S. market news, insights and key dates delivered to your inbox.


AInvest
PRO
AInvest
PRO




Comments
No comments yet