
Arch Capital Trades Above 200-Day SMA: Time to Hold the Stock?
Arch Capital Group Ltd. ACGL has been trading above its 200-day simple moving average (SMA), signaling a short-term bullish trend. Its share price as of Wednesday was $93.32, down 9.7% from its 52-week high of $103.39.
The 200-day SMA is a long-term technical indicator that averages a stock's closing price over the last 200 trading days to smooth out volatility and identify the broader trend direction. When the stock price crosses above the 200-day SMA, it can be a signal to buy or hold.
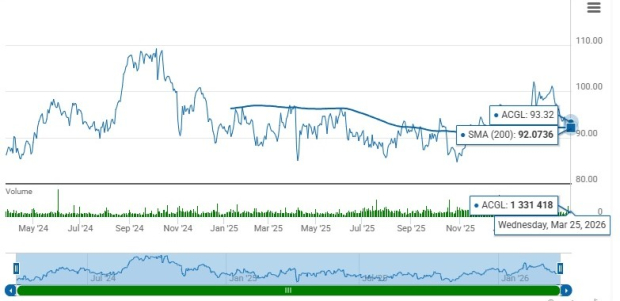
Image Source: Zacks Investment Research
ACGL’s Expensive Valuation
Based on the forward 12-month price-to-book ratio, American FinancialAFG-- is currently trading at 1.45X, above its industry average of 1.4X.
The insurer has a Value Score of B. Shares of other insurers like The Allstate Corporation ALL, W.R. Berkley Corporation WRB and The Progressive Corporation PGR are also trading at a multiple higher than the industry average.
ACGL’s Price Performance
Arch Capital shares have lost 2.7% year to date compared with the industry, the Finance sector and the Zacks S&P 500 composite’s decline of 4.4%, 6.2% and 4.6%, respectively.
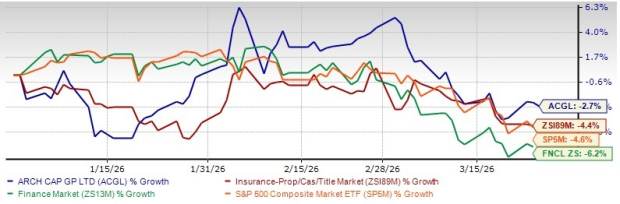
Image Source: Zacks Investment Research
ACGL Growth Projection
The Zacks Consensus Estimate for Arch Capital’s 2027 earnings per share and revenues indicates a year-over-year increase of 8.3% and 3.4%, respectively, from the corresponding 2026 estimates. Earnings have grown 30% in the past five years, better than the industry average of 22.5%.
Earnings Surprise History
The insurer has a solid track record of beating earnings estimates in each of the past four quarters, with an average of 17.57%.
Return on Capital of ACGL
Arch Capital’s trailing 12-month return on equity is 16.7%, ahead of the industry average of 7.3%. Return on equity, a profitability measure, reflects how effectively a company is utilizing its shareholders’ equity.
Key Points to Note for ACGLACGL-- Stock
Arch Capital’s well-rounded product portfolio and consistent premium growth highlight the strength of its organic drivers. Rate increases, new business inflows and expansion within existing accounts continue to fuel its momentum. Additionally, its ability to scale organically across specialty insurance and reinsurance underscores sustained growth potential.
Building on this momentum, Arch CapitalACGL-- has delivered steady premium acceleration, with net premiums written registering a seven-year (2018-2025) CAGR of 17.4%. The combination of firm market rates, inflation-led demand and disciplined underwriting has strengthened growth across P&C lines.
Arch Capital is also benefiting from favorable dynamics in the P&C market, where a hardening environment is supporting higher premiums and stronger demand for coverage. While industry-wide pressures, such as catastrophe losses and inflation, have intensified claims costs, they have also driven rate momentum. With its underwriting discipline, global distribution and focus on specialty lines, Arch Capital is well-placed to capitalize on these conditions.
Conclusion
Overall, Arch Capital continues to benefit from strong organic growth drivers, steady premium momentum and a solid competitive position in key markets.
Arch Capital boasts a strong product portfolio and has a solid track record of premium growth, as well as favorable return on capital. Both the Insurance and Reinsurance segments should continue to witness significant growth from increases in most lines of business. A robust capital position over the years reflects its financial flexibility.
Its solid growth projections, higher target price and favorable return on capital should continue to benefit Arch Capital over the long term. The stock currently carries a Zacks Rank #3 (Hold). You can see the complete list of today’s Zacks #1 Rank (Strong Buy) stocks here.
Zacks Names #1 Semiconductor Stock
This under-the-radar company specializes in semiconductor products that titans like NVIDIA don't build. It's uniquely positioned to take advantage of the next growth stage of this market. And it's just beginning to enter the spotlight, which is exactly where you want to be.
With strong earnings growth and an expanding customer base, it's positioned to feed the rampant demand for Artificial Intelligence, Machine Learning, and Internet of Things. Global semiconductor manufacturing is projected to explode from $452 billion in 2021 to $971 billion by 2028.
See This Stock Now for Free >>Want the latest recommendations from Zacks Investment Research? Today, you can download 7 Best Stocks for the Next 30 Days. Click to get this free report
W.R. Berkley Corporation (WRB): Free Stock Analysis Report
The Allstate Corporation (ALL): Free Stock Analysis Report
The Progressive Corporation (PGR): Free Stock Analysis Report
Arch Capital Group Ltd. (ACGL): Free Stock Analysis Report
This article originally published on Zacks Investment Research (zacks.com).
Zacks is the leading investment research firm focusing on equities earnings estimates and stock analysis for the individual investor, including stock picks, stock screening, portfolio stock tracker and stock screeners. Copyright 2006-2026 Zacks Equity Research, Inc. editor@zacks.com (Manaing editor) webmaster@zacks.com (Webmaster)
Latest Articles
Stay ahead of the market.
Get curated U.S. market news, insights and key dates delivered to your inbox.


AInvest
PRO
AInvest
PRO
Comments
No comments yet