
Applied Therapeutics (APLT.O) Plunges Over 47%—No Fundamental News, So What’s Driving the Move?
Technical Signal Analysis
Applied Therapeutics (APLT.O) ended the day down over 47.6%, one of the largest single-day drops in recent memory. Despite a lack of new fundamental news, the stock’s technical signals tell a story of bearish momentum. Notably, the KDJ Death Cross and RSI Oversold indicators were triggered.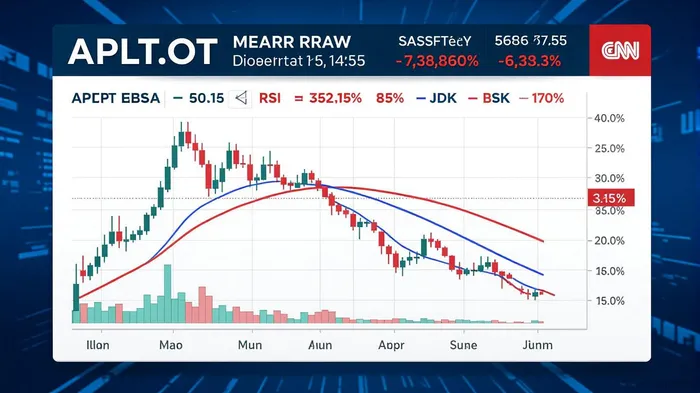
The KDJ Death Cross typically signals bearish momentum as the J line crosses below the K line, pointing to increased selling pressure. The RSI Oversold condition suggests that the stock has fallen sharply, possibly attracting short-covering or panic selling. However, the absence of triggering on other reversal or continuation patterns like the Head and Shoulders or Double Top implies that there may not be a clear structural pivot point guiding the move—pointing instead to sentiment-driven selling.
Order-Flow Breakdown
Unfortunately, there is no block trading data or specific order flow information available for APLTAPLT--.O on this day. However, the sheer volume of 12.89 million shares traded implies heightened participation from retail or institutional actors. Without bid/ask clusters or major inflows/outflows, it's difficult to pinpoint whether the drop was driven by a single large seller or broad-based fear.
It’s also worth noting the market cap of APLT.O at around $16.5 million, indicating the stock is extremely small-cap and more susceptible to volatility. In such cases, a small number of traders can move the market significantly.
Peer Comparison
The performance of related theme stocks was mixed. Some, like ADNT (+1.13%) and AXL (+0.7%), showed slight gains, while BEEM (-0.72%) and ATXG (0.0%) posted losses. The divergence in performance suggests sector rotation might not be the primary driver—rather, APLT.O appears to have been affected by internal dynamics rather than sector-wide forces.
The fact that other biotech and pharmaceutical peers did not follow suit implies the move is more isolated. If APLT.O had been caught in a broader sector sell-off, we would expect more of its peers to show similar declines.
Hypothesis Formation
Short-term panic selling triggered by liquidity crunch or margin calls: Given the RSI oversold condition and lack of strong technical support levels, it's possible that a margin call or liquidity event forced large holders to sell off their stake quickly, triggering a rapid price drop.
Algorithmic trading and sentiment-driven decay: With no block trades reported, it's likely that algorithmic trading strategies—perhaps based on overbought RSI and Death Cross signals—accelerated the sell-off. This could have led to a self-fulfilling prophecy where the falling price triggered more selling.
Visual
Backtest
Stay ahead of the market.
Get curated U.S. market news, insights and key dates delivered to your inbox.
AInvest
PRO
AInvest
PRO
Comments
No comments yet