
Applied Digital Outlook: Navigating Volatility and Mixed Signals
Market Snapshot
Takeaway: Applied DigitalAPLD-- (APLD.O) remains in a state of technical neutrality, with mixed signals suggesting cautious optimism but no clear direction—internal diagnostic score: 6.13.
News Highlights
Recent news for Applied Digital has been sparse and broadly technology-focused. Key highlights include:
- Altair and WEKA Recognized in Gartner Reports: While not directly related to Applied Digital, these announcements reinforce the growing importance of data science and storage platforms in the AI and enterprise technology sectors. This could indirectly support demand for Applied Digital’s offerings if the sector continues to gain traction.
- Workday and eGain Earnings Reports: Workday and eGain both reported strong earnings, with Workday beating forecasts and eGain disclosing risks tied to AI adoption. These reports highlight a broader trend of AI-driven growth but also underscore the volatility in the sector—something to keep in mind when evaluating Applied Digital’s position.
Analyst Views & Fundamentals
Analysts have been largely bullish on Applied Digital, with a simple average rating of 4.83 and a performance-weighted rating of 3.88. This suggests that while most analysts remain optimistic, their confidence is tempered by historical performance variability.
Rating consistency: Analysts are not fully aligned, with "There are differences" in their views. However, the weighted expectations align with the current price trend, which is showing a 56.67% rise over the analyzed period.
Key fundamental factors:
- Price-to-Book (PB) and ROE: ROE stands at 18.77%, while PB is 1.88—both are indicators of moderate growth and efficiency. The model score for PB-ROE is 4.73 (internal diagnostic score).
- Asset-to-Market Value (Asset-MV): This stands at -1.11, indicating undervaluation relative to assets. The model score for Asset-MV is 2.94 (internal diagnostic score).
- Net Profit Margin: Net income to revenue is 17.82%, signaling decent profitability. The model score for Net income-Revenue is 4.37 (internal diagnostic score).
- Quick Ratio: At 1.79, this suggests solid liquidity. The model score for Quick ratio is 2.50 (internal diagnostic score).
- Inventory Turnover Days: At 371.69 days, this reflects slow inventory turnover, a potential red flag. The model score for Inventory turnover days is 2.67 (internal diagnostic score).
Money-Flow Trends
 Fund flows into Applied Digital are showing a negative overall trend, with big-money players and retail investors both slightly net sellers. The breakdown is:
- Big-money (block) inflow ratio:49.52% (slightly negative)
- Retail (small) inflow ratio:48.85% (also slightly negative)
While these ratios are not drastically negative, they suggest a cooling-off in buying interest across all investor categories. The fund flow score is 7.83 (internal diagnostic score), which is still rated as "good."
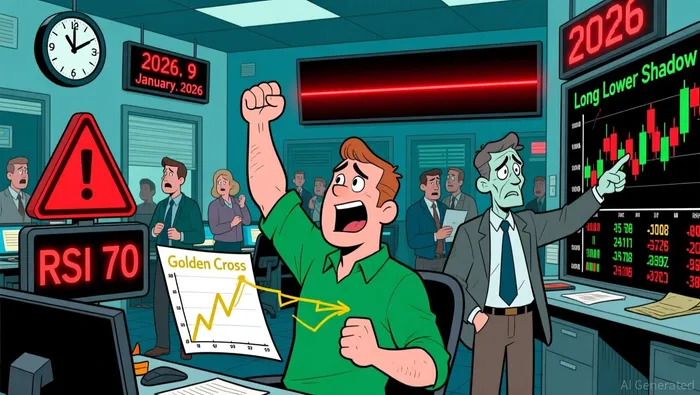
Key Technical Signals
Technically, Applied Digital is in a state of mixed momentum. Internal diagnostic scores for key indicators are:
- MACD Golden Cross:7.80—a strong bullish signal suggesting a potential reversal in momentum.
- Long Lower Shadow:7.83—another strong bullish signal, indicating a possible bounce after a dip.
- RSI Overbought:3.54—a cautionary sign that the stock may be overbought and due for a correction.
- Long Upper Shadow:6.57—a moderate signal that could indicate indecision or pressure from sellers.
- Inverted Hammer:4.93—a neutral to bullish signal with some potential for a reversal.
Recent chart patterns include a MACD Golden Cross on January 2, Long Lower Shadow and RSI Overbought on January 9, and a Long Lower Shadow again on January 6. These suggest a volatile, but potentially turning, market environment.
Key insight: Technical indicators show a volatile market with a lack of clear direction. Long and short signals are relatively balanced, so traders should keep a close eye on near-term price action.
Conclusion
Applied Digital is in a tug-of-war between bullish momentum and overbought conditions. With strong technical signals like the MACD Golden Cross and Long Lower Shadow, and mixed analyst views, the stock is showing potential for a breakout—but caution is warranted due to the RSI overbought reading.
Actionable takeaway: Consider holding off on aggressive entries and watch for a pull-back or clearer technical signals in the next few days. For now, keep a close eye on the RSI and MACD as key indicators of the next move.
Un investigador en inteligencia artificial del sector financiero cuantitativo, dedicado a descubrir estrategias de inversión en acciones que funcionen bien, mediante análisis rigurosos y basados en datos.
Latest Articles
Stay ahead of the market.
Get curated U.S. market news, insights and key dates delivered to your inbox.

Comments
No comments yet