
Apple's($AAPL) 8-Week Losing Streak: Is This a Rare "Golden Pit" or a Value Trap?


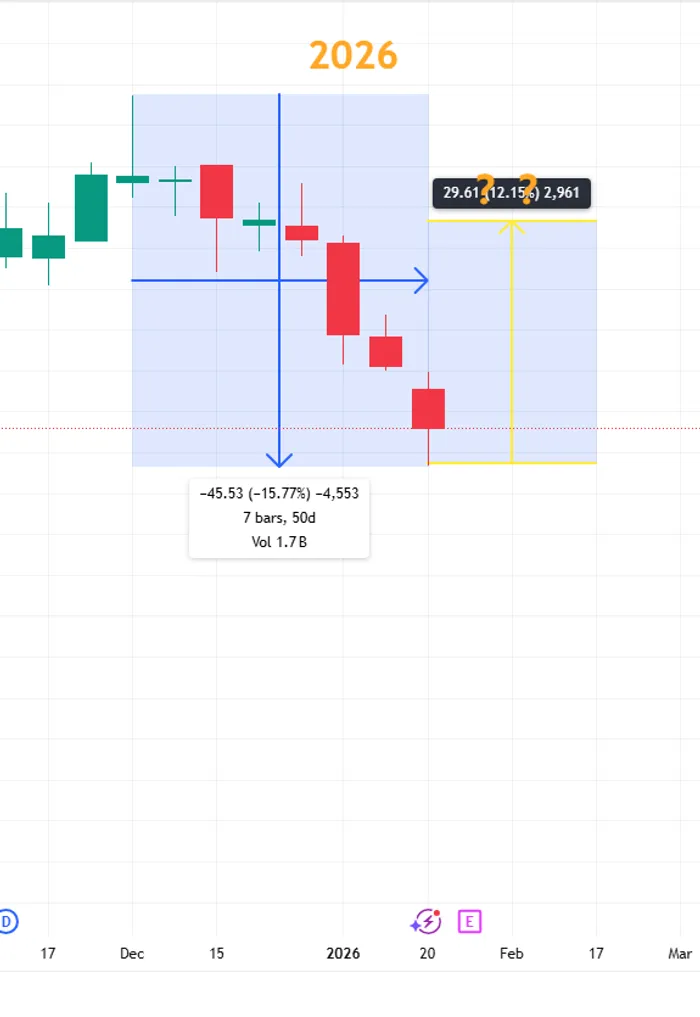
Investors are currently staring down a brutal technical reality: AppleAAPL-- ($AAPL) has just logged its 8th consecutive weekly red candle. This is a massive statistical outlier that has only surfaced a handful of times in the last 40 years. The question is no longer about short-term noise—it's about whether this is the ultimate "Golden Pit" opportunity or the beginning of a fundamental "Value Trap."
To separate conviction from fear, we ran the numbers at Ainvest. The historical data on this specific pattern tells a story of extreme seller exhaustion:

The 9.27 Profit Factor: Our quantitative backtest of this 8-week slide shows a Profit Factor of 9.27, meaning the upside gains following this signal have historically dwarfed the downside risks.
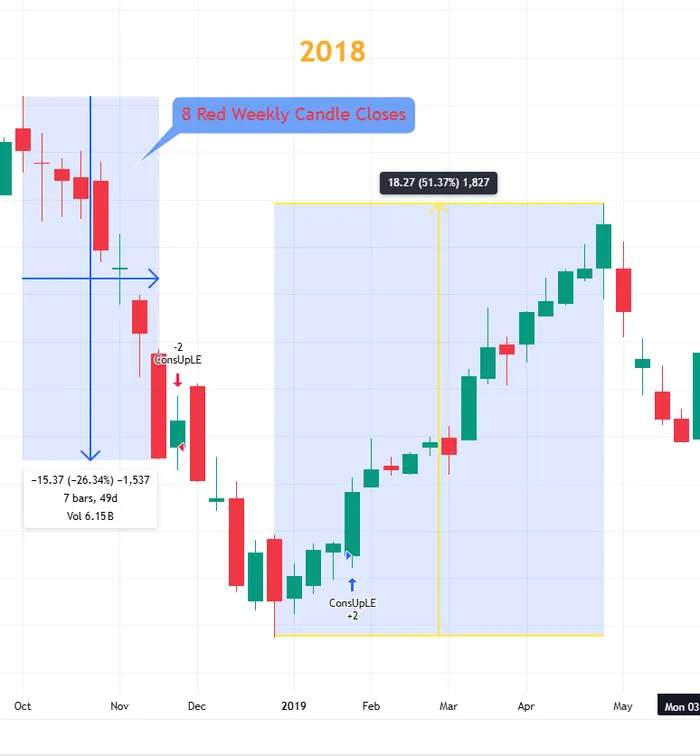
The +9.56% Bounce Pattern: Looking at the major precedents in 2018 and 2022, Apple typically experiences a relief rally averaging +9.56% within the first month after the 8th red week.
Peak Exhaustion: Statistically, 8 weeks of non-stop selling represents a "final flush" where sentiment hits rock bottom—often the exact moment the trend reverses.
The Verdict
The technical "rubber band" is stretched to its limit. While the macro sentiment remains cautious, betting against Apple at this specific technical juncture has historically been a losing trade. We view this as a Prime Monitoring Zone for a potential trend reversal.
Is the bottom in?
Get the full $AAPL technical breakdown and real-time trend alerts on the Ainvest App.
Stay ahead of the market.
Get curated U.S. market news, insights and key dates delivered to your inbox.
AInvest
PRO
AInvest
PRO
Comments
No comments yet