
API3USDT Stalls in Narrow Range — Will 0.2764 Hold?
Summary
• Price action shows consolidation between 0.2764 and 0.2803 with no decisive breakout.
• Momentum remains balanced with RSI hovering near the 50 level and no clear overbought/oversold signals.
• Volume and turnover suggest moderate interest but no sharp spikes or divergences.
• A doji appears near 0.2764, hinting at indecision or a potential support level.
• Bollinger Bands show mild contraction, indicating lower volatility with price centered within the band.
Price and Volume Activity
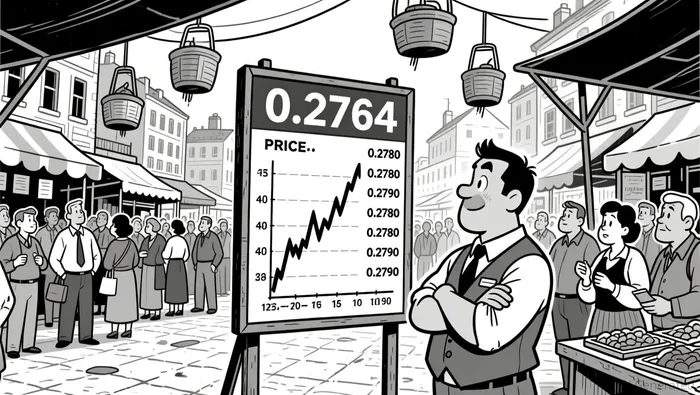
API3/Tether (API3USDT) opened at 0.2795 on 2026-03-23 at 16:00 ET and reached a high of 0.2805 before closing at 0.2787 by 12:00 ET on 2026-03-24. The 24-hour range was between 0.2764 and 0.2805. Total volume traded was 525,265.03, with a notional turnover of 145,786.63.
Structure and Patterns
Price action within the 24-hour window shows a tight trading range centered around key levels. A small doji at 0.2764 suggests a temporary pause in bearish pressure, while a moderate bullish rejection appears near 0.2805. The price has formed a narrow consolidation channel, lacking strong directional momentum.
Moving Averages and Bollinger Bands
On the 5-minute chart, the 20 and 50-period moving averages remain closely aligned near the mid-range of 0.2780–0.2790. Bollinger Bands indicate a period of lower volatility, with price hovering near the midline. This may suggest a potential breakout or continuation in the near term, but further confirmation is needed.
Momentum and Volatility
The RSI is currently near neutral at ~49, with no clear overbought or oversold signals. The MACD histogram shows a flat line, indicating no significant momentum bias. Volume has remained steady with no sharp spikes, suggesting balanced buying and selling pressure.
Volume and Turnover Observations
Notional turnover has remained relatively steady throughout the session, with no sharp divergences between price and turnover. Volume spikes occurred near key support and resistance levels, but they were not enough to drive the price beyond these ranges.
Fibonacci Retracements
On the 5-minute chart, the 0.2775–0.2805 swing has defined key retracement levels. The 0.2764 level aligns with the 61.8% Fibonacci support, suggesting it may act as a short-term floor. Buyers may test this level again in the near term.
The market appears to be in a state of indecision, with price consolidating in a narrow range and no strong directional bias. While a breakout is possible, the lack of momentum and volume support suggests traders should watch for confirmation before taking positions. Volatility may increase if the 0.2764 or 0.2805 levels are tested again in the next 24 hours. As always, risk management remains critical in this volatile environment.
Decoding market patterns and unlocking profitable trading strategies in the crypto space
Latest Articles
Stay ahead of the market.
Get curated U.S. market news, insights and key dates delivered to your inbox.


AInvest
PRO
AInvest
PRO
Comments
No comments yet