
ApeCoin Volume Spike Fails: Distribution Drives Price Lower
 Aime Summary
Summary
- ApeCoin/USDC faces bearish pressure with a lower low structure and failed breakout attempts.
- Volume spikes at 10:00 UTC failed to sustain momentum, indicating weak buyer conviction.
- Price trades near critical support, with resistance acting as a dynamic ceiling for rallies.
- Market appears to be in a corrective phase following recent volatility and distribution.
Market OverviewCorrective Consolidation
ApeCoin/USDC (APEUSDC) closed the latest hour at 0.1325, with a 24-hour total volume of approximately 1,800,000 USDCUSDC--. The asset exhibits a bearish market structure with price action testing key support levels while failing to hold gains above resistance.
1-Hour Support/Resistance and Candlestick Patterns
Price action reveals a distinct lower low structure, confirming a bearish bias in the short term. The market has encountered repeated rejection at the 0.1340 to 0.1345 zone, where multiple candles displayed long upper shadows, indicating strong selling pressure at these higher prices. Conversely, the 0.1317 to 0.1320 area has acted as a temporary support floor, though it was recently breached with a significant volume spike. Candlestick patterns further support this bearish narrative; a bearish engulfing pattern appeared at 08:00 UTC, followed by another at 10:00 UTC during the highest volume hour. The 10:00 UTC candle also featured a long upper shadow, signaling that buyers attempted to push price higher but were overwhelmed by sellers. Currently, the price of 0.1325 is closer to the immediate support zone than to the stronger resistance levels located above 0.1340, suggesting that downside risk remains elevated if support fails to hold.
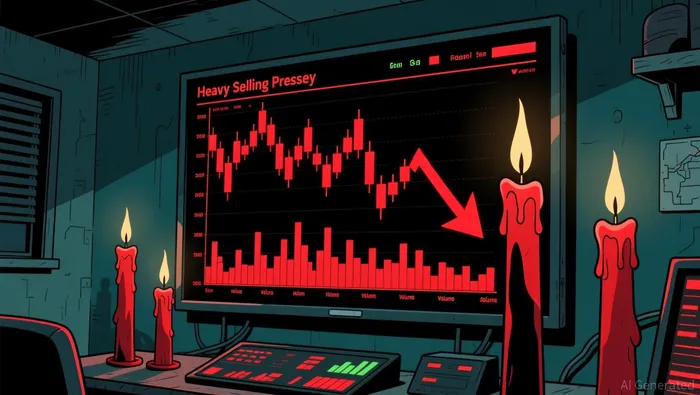
Volume and Turnover vs. Historical Comparison
The 24-hour total volume for APEUSDCAPE-- is estimated at roughly 1,800,000 USDC, which is slightly above the 7-day average daily volume of 2,168,801 USDC but below the 15-day average of 2,757,541 USDC. This suggests that while trading activity is present, it has not reached the heightened levels seen over the longer 15-day period. Significant volume spikes occurred at 03:00 UTC (243,655 USDC) and 10:00 UTC (624,886 USDC), both exceeding twice the 7-day average single-hour volume of 90,366 USDC. The spike at 03:00 UTC resulted in a modest price increase, but the subsequent hours showed no sustained follow-through, leading to a gradual drift lower. The more critical anomaly occurred at 10:00 UTC, where massive volume coincided with a sharp price drop from 0.1338 to 0.1321. This high-volume selling event suggests that the volume anomaly effectively drove price lower, indicating distribution rather than accumulation. The lack of follow-through buying in the hours after the 03:00 spike confirms that the recent volume increases have not been sufficient to reverse the downward pressure.
Look Back: Current Market Phase
The broader market structure over the last 7 to 15 days indicates a downtrend phase. This is evidenced by the consistent formation of lower highs and lower lows, with the recent price action failing to establish a higher high above the 0.1345 resistance. The 7-day price change of -5.09% further confirms the bearish momentum, while the 3-day change of +1.22% appears to be a minor corrective rally within the larger downtrend rather than a trend reversal. The market is not in a sideways range, as the price has broken below previous consolidation zones, nor is it in an uptrend. Therefore, the current phase is best described as a corrective downtrend, where price is likely to continue testing lower support levels unless a significant volume-backed breakout occurs above resistance.
For the next 24 hours, ApeCoin/USDC may continue to face downward pressure as it tests the 0.1310 support zone. A break below this level could accelerate losses toward 0.1300, while a sustained move above 0.1345 would be required to suggest a potential shift in momentum. Investors should monitor volume closely for any signs of buyer exhaustion or renewed selling pressure.

Decoding market patterns and unlocking profitable trading strategies in the crypto space
Latest Articles
Stay ahead of the market.
Get curated U.S. market news, insights and key dates delivered to your inbox.


AInvest
PRO
AInvest
PRO




Comments
No comments yet