
ApeCoin Trapped: Sellers Block Upside as Volume Fades
 Aime Summary
Summary
- ApeCoin faces resistance near 0.1345 while holding support at 0.1311 during sideways consolidation.
- Trading volume remains below 7-day averages, indicating weak conviction and lack of directional momentum.
- Bearish candlestick patterns emerge near local highs, suggesting sellers are defending key supply zones.
- Price action stays within a tight range, reflecting equilibrium between buyers and sellers.
- Market appears vulnerable to downside if support breaks, with upside capped by overhead supply.
Range Contraction with Bearish Bias
ApeCoin/Tether (APEUSDT) closed the latest hour at 0.1323, with 24-hour total volume reaching 143,665 tokens. The market exhibits low volatility and indecision as price consolidates within a narrow band.
1-Hour Support/Resistance and Candlestick Patterns
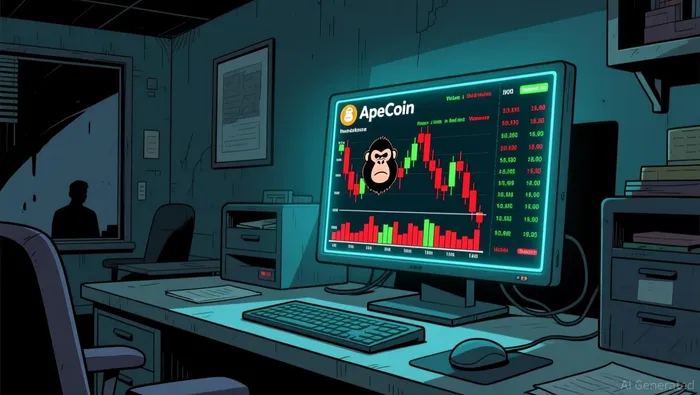
Price action suggests the asset is trading closer to support than resistance, with the current level of 0.1323 resting near the lower boundary of the recent hourly range. Key resistance has been tested multiple times near 0.1340 to 0.1345, where sellers have repeatedly stepped in to reject higher prices. For instance, the hour ending at 06:00 on August 4th saw a high of 0.1346 followed by a close near 0.1344, indicating rejection. Similarly, the 03:00 hour recorded a high of 0.1344 with a close of 0.1332, forming a candle with a long upper shadow. This wick is significantly longer than the body, which satisfies the rule for a long-wick rejection pattern, signaling that buyers failed to sustain momentum above 0.1332. On the downside, support appears to be holding around 0.1311, as seen in the 13:00 hour on August 3rd where the low was 0.1311 and price bounced back to close at 0.1316. The 17:00 hour on August 3rd displayed a bearish engulfing pattern, where the closing price of 0.1320 was lower than the previous close of 0.1324, and the body covered the prior candle's range, suggesting selling pressure increased at that moment. The presence of these patterns indicates that upward moves are being met with supply, while downward moves find temporary footing.
Volume and Turnover vs. Historical Comparison
The 24-hour total volume of approximately 143,665 tokens is notably lower than the 7-day average daily volume of 540,682 tokens and the 15-day average of 617,544 tokens. This disparity suggests that current trading activity is subdued compared to recent historical norms. When examining hourly volume against the 7-day average single-hour volume of roughly 22,528 tokens, no single hour in the provided 24-hour window exceeded twice this thresholdT--. The highest hourly volume recorded was 22,289 tokens during the 20:00 hour on August 3rd, which is just below the 45,056 token threshold required for a spike. Consequently, there are no significant volume anomalies to analyze in terms of follow-through. The lack of high-volume spikes means that price movements are not being driven by aggressive institutional or large-scale retail participation. Instead, the market is drifting with low conviction. The bearish engulfing pattern observed at 17:00 occurred on relatively low volume, implying that the selling pressure might not be sustainable but also that there is no strong buying interest to counter it.
Look Back: Current Market Phase
The market structure over the past 15 days indicates a sideways or range-bound phase. The 15-day daily price range is recorded as 0.03, which is a narrow band relative to typical crypto volatility, supporting the classification of a consolidation phase. The 7-day price change is negative at -4.68%, while the 3-day change is positive at 1.46%, suggesting a recent slight recovery within a broader downtrend or consolidation. The market structure feature provided is explicitly 'range bound'. Price has not established a clear sequence of higher highs and higher lows to indicate an uptrend, nor has it sustained lower highs and lower lows to confirm a strong downtrend at this specific moment. Instead, the price is oscillating between key support levels near 0.1300 and resistance near 0.1350. This behavior is consistent with a mean reversion or accumulation/distribution phase where traders are waiting for a breakout. The lack of significant price expansion over the last week reinforces the view that the market is in a period of equilibrium.
Looking ahead, the market may continue to consolidate within the 0.1310 to 0.1345 range unless a significant volume surge occurs. A break below 0.1310 could trigger further downside risk toward 0.1287, while a sustained move above 0.1345 might signal a shift toward testing higher resistance levels. Investors should monitor volume for confirmation of any directional break.

Decoding market patterns and unlocking profitable trading strategies in the crypto space
Latest Articles
Stay ahead of the market.
Get curated U.S. market news, insights and key dates delivered to your inbox.


AInvest
PRO
AInvest
PRO




Comments
No comments yet