

Everyone has seen the chart, and it is genuinely something. Anthropic's annualized revenue run rate went from $9 billion in October 2025 to $65 billion by the end of July 2026 — roughly a sevenfold jump inside ten months. The bull case writes itself: demand this explosive justifies a listing Wall Street is quietly modeling at $2 trillion, which would make it the biggest initial public offering in history, and that is before OpenAI, leaning toward a $1 trillion debut of its own, even goes public.
Here is the thing the chart never shows. That celebrated run rate is not the foundation the $2 trillion sits on. It is the denominator of a bet on revenue you do not have yet.
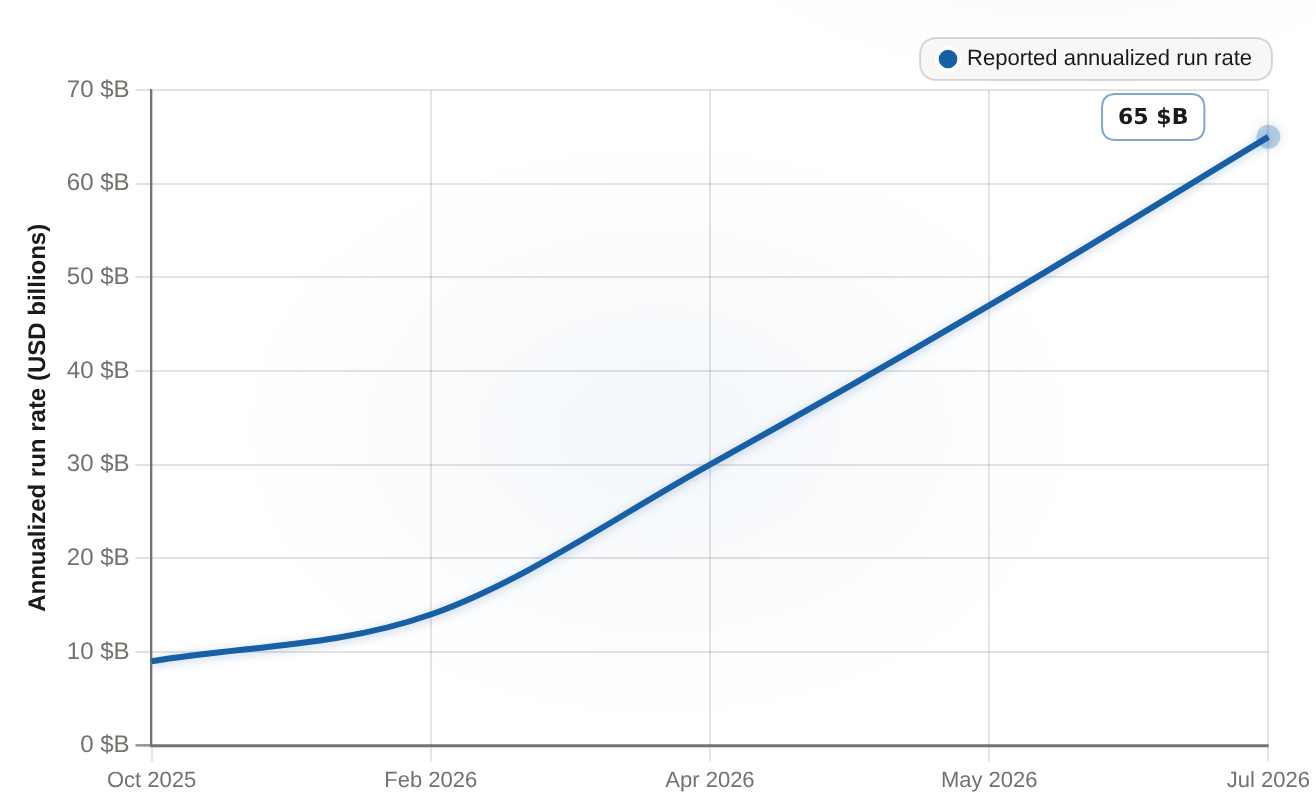
Reported annualized revenue run rate exploded roughly 7x from $9B (Oct 2025) to $65B (Jul 2026), the steep forward-revenue base underwriting the IPO narrative.
| Period | Reported annualized run rate ($B) |
|---|---|
| Oct 2025 | 9 |
| Feb 2026 | 14 |
| Apr 2026 | 30 |
| May 2026 | 47 |
| Jul 2026 | 65 |
Start with the escalation, because it is real and worth taking seriously. The company itself reported the run-up: $14 billion by February, $30 billion by April, $47 billion by mid-May, $65 billion by end of July, a pace that compounded more than tenfold a year through early 2026. None of that is in dispute. The dispute is what the number authorizes.
Watch how the underwriting actually works. Bankers are not valuing Anthropic against its current earnings — because there essentially are none beyond a first projected quarterly operating profit of about $559 million. Instead, they are applying revenue multiples to a forecast. Reuters reported that bankers and investors are using enterprise-value-to-revenue multiples derived from projected revenue, anchored on comparables that are themselves estranged from ordinary math: Palantir at 53 times expected current-year revenue, SpaceX and Cloudflare at roughly 41.6 times expected 2026 revenue. And the revenue they project is not this year's. They are underwriting against roughly $190 billion to $200 billion of revenue in 2028.
Now give that valuation two honest denominators and see which one is doing the work.
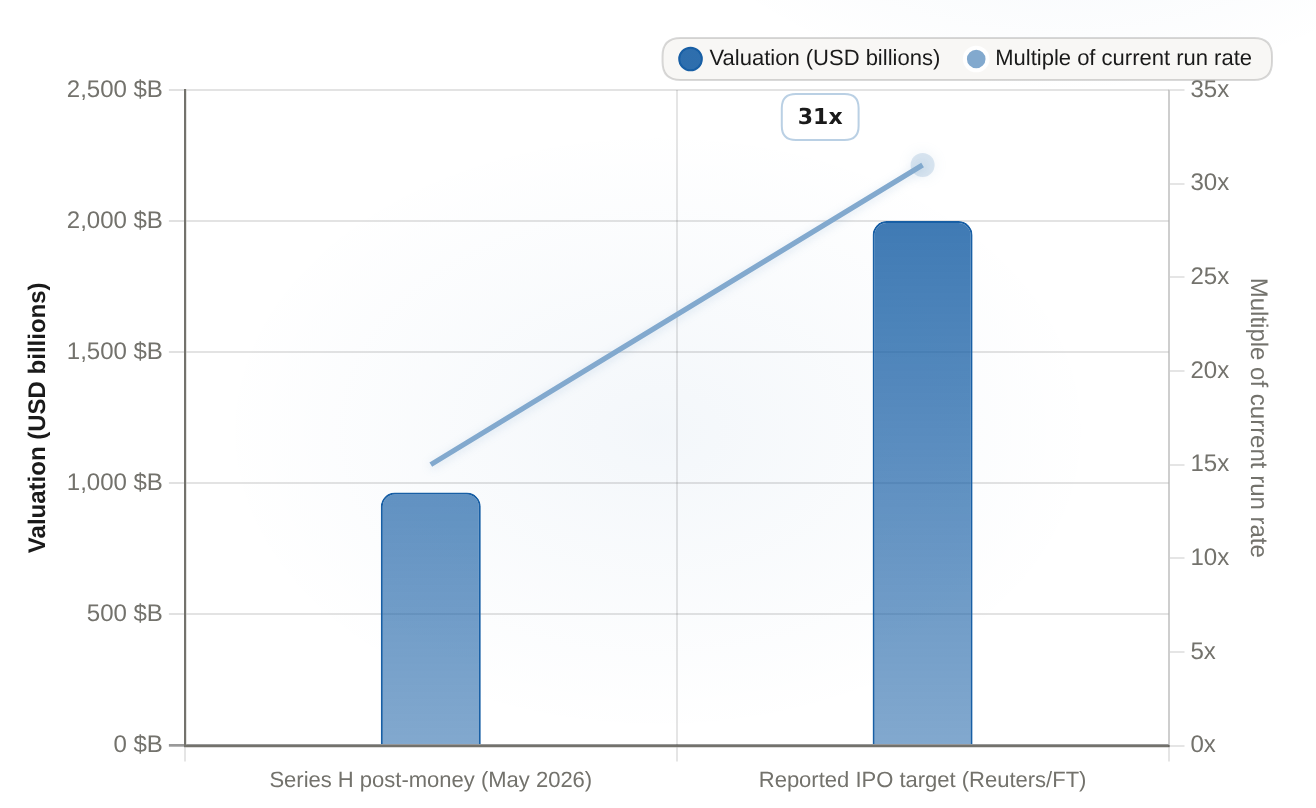
On the same $65B annualized run-rate base, the $965B Series H round prices at ~15x revenue while the reported ~$2T IPO target reaches ~31x.
| Anchor | Valuation (USD billions) ($B) | Multiple of current run rate (x) |
|---|---|---|
| Series H post-money (May 2026) | 965 | 15 |
| Reported IPO target (Reuters/FT) | 2000 | 31 |
At the $965 billion Series H that closed in May, Anthropic traded at roughly 15 times its $65 billion July run rate. The reported $2 trillion IPO target is about 31 times that same current revenue. That is the price of the story you are being sold today. The $2 trillion target only falls to a saner-looking roughly 10 to 11 times — the multiple investors are actually shown — when you divide by the $190 billion-to-$200 billion 2028 base that still has to be earned. The multiple appears reasonable precisely because it is built on a number that does not exist yet.
The reference points make this worse, not better. The one public comparable the underwriting leans on, Palantir, is itself an outlier: real-time market data on September 10, 2026 showed Palantir trading at roughly 66 times trailing price-to-sales and about 135 times trailing earnings, according to Ainvest data. The "anchor" is an extreme in its own right. So the structure stacks forward revenue on a multiple that is already a stretch. That is not a neutral base rate. It is a house of cards pricing the next house of cards.
This matters in the ordinary arithmetic an investor can do at home, and it is the whole point. A $2 trillion valuation divided by current revenue is 31x. Nobody would call that cheap. The structure only looks defensible if revenue genuinely reaches the 2028 forecast — which requires the run rate to roughly triple from today's $65 billion. That is the hidden premise the celebrated chart invites everyone to skip: not that growth has been strong, but that a base already seven times bigger than it was a year ago keeps compounding instead of flattening.
The same fragility sits inside the numerator. Part of that $65 billion may be cloud-reseller spend that passes through, and a secondary forecaster flagged that a gross-to-net restatement could cut headline run rate by 20% to 40% if tightening definitions apply. To be clear: that is a scenario, not a disclosed fact, and the analyst who floated it thinks the auditor risk is low. But it names the axis. If the base number shrinks, the multiple on it telescopes up before a single 2028 dollar is earned.
OpenAI shows the ceiling of the whole genre. Its run rate passed $25 billion by early 2026, yet it is projected to burn roughly $27 billion this year, rising to about $63 billion in 2027, with cash-flow positivity not projected until around 2030. These are not businesses valued on cash flow. They are valued on flows of capital and expectations that must both hold. Cheap money must stay cheap, investor appetite for loss-making hypergrowth must stay firm, and the revenue curve must not break — any one of which compresses the multiple long before the 2028 bookings arrive.
None of this means the forecast is wrong, or that a restatement is coming, or that these companies cannot become enormous. It means the price is a forward bet, not a measurement. The moment an S-1 lands with actual GAAP revenue, gross margins, and burn, the promotional run rate meets accounting, and the reader finally gets to see whether 31 times current revenue was an anchor or a leap of faith. Until then, admire the curve. Just do not mistake the denominator for the earnings it is standing in for.








Comments
No comments yet