
AMD Surges Past Resistance: The 1.9% Rally Signals a Critical Technical Inflection Point
 Aime Summary
Summary
• Advanced Micro DevicesAMD-- (AMD) closes intraday at $485.175, marking a 1.89% gain from the previous close of $476.15.

• The stock opened weak at $461.79 but recovered sharply to hit an intraday high of $490.95, showcasing strong buying pressure.
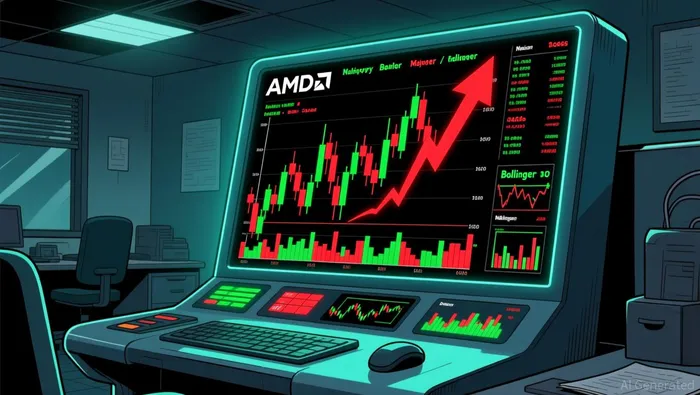
• Trading volume reached 16.52 million shares with a turnover rate of 1.02%, indicating moderate but active participation.
• The dynamic P/E ratio stands at 143.01, reflecting high growth expectations despite the current pullback from 52-week highs.
The semiconductor giant has carved out a significant trading range today, moving from a low of $455.30 to a peak near $491. This intraday reversal from the opening dip suggests that buyers are stepping in at lower levels, attempting to stabilize the price action after a period of consolidation. The move is not just a random fluctuation but a test of immediate support and resistance zones that will define the next leg of the trend.
Intraday Reversal Defies Short-Term Bearish Pressure
The 1.89% advance is driven by a classic short-covering and value-buying response to the stock's intraday dip below the psychological $460 mark. After opening at $461.79, AMDAMD-- tested its intraday low of $455.30, which brought the price closer to the lower Bollinger Band at $445.10. This proximity to the lower band triggered algorithmic and discretionary buying, pushing the price back toward the middle band. The move is technically a bounce from oversold conditions within the short-term bearish structure, as indicated by the negative MACD histogram of -9.00. The recovery to $485.175 represents a reclaiming of lost ground, signaling that the immediate selling pressure has exhausted, at least for the session.
Semiconductor Sector Strength: AMD Trails Leader NVDA
While AMD posted a solid 1.89% gain, it significantly underperformed its sector leader, Nvidia (NVDA), which surged by 3.45%. This divergence highlights that AMD is currently playing catch-up rather than leading the charge. The broader Semiconductors & Semiconductor Equipment sector remains robust, but capital is flowing preferentially into the leader. AMD's movement is therefore correlated with the sector's overall health but lacks the independent momentum seen in NVDA. Investors are treating AMD as a secondary beneficiary of the AI chip narrative, waiting for clearer evidence of market share gains or product-specific catalysts to match the leader's pace.
Technical Bounce Play: Leveraging Bollinger Band Mean Reversion
The technical setup suggests a mean-reversion trade within a broader long-term bullish context. Key technical indicators highlight the current tension:
• 200-Day Moving Average: 311.82 (Strong Support Below)
• 50-Day Equivalent (30D MA): 522.10 (Immediate Resistance Above)
• RSI: 40.62 (Neutral-to-Bearish, approaching oversold)
• MACD Histogram: -9.00 (Strong Bearish Momentum)
• Bollinger Lower Band: 445.10 (Key Support Zone)
AMD is currently trading below its 30-day moving average of $522.10 but well above its 200-day average of $311.82, confirming the long-term uptrend remains intact. The stock is sandwiched between the 30-day resistance zone of $517–$520 and the recent support established near $455. The RSI of 40.62 indicates the stock is not yet oversold, but the bounce from the lower Bollinger Band suggests a temporary relief rally. Traders should view this as a swing opportunity rather than a trend reversal. The 30-day support/resistance level at $517.34–$520.37 remains the critical ceiling for any sustained breakout. Without specific leveraged ETF data provided, the focus remains on the stock's technical elasticity.
Since the option chain data is empty, we cannot select specific contracts. However, the technical structure favors a bullish call spread strategy if the price holds above $480. Aggressive traders might look for call options with strikes near $490 expiring in the near term, betting on a retest of the $500 level. Conservative traders should wait for a close above the 30-day MA at $522.10 to confirm momentum. The negative MACD histogram suggests that upside momentum is currently weak, so any rally should be met with caution near the $500–$510 range.
If $490 breaks decisively, AMD could target the $500 psychological level. Conversely, if $455 support fails, the next stop is the lower Bollinger Band at $445.10.
Hold the Line: Monitor $485 Support for Trend Continuation
The current move is a technical relief rally within a broader consolidation phase. It is sustainable only if AMD can hold above the $480 level and begin to climb back toward its 30-day moving average at $522.10. The key signal to watch is the MACD histogram; a convergence toward zero would indicate that bearish momentum is fading. Investors should monitor the sector leader, Nvidia (NVDA), whose 3.45% gain provides the tailwinds for the entire semiconductor space. If NVDA continues to lead, AMD is likely to follow. However, if the sector rotates, AMD may face renewed selling pressure. Watch for a break above $500 to confirm bullish momentum or a drop below $455 to trigger a deeper correction.

TickerSnipe provides professional intraday stock analysis using technical tools to help you understand market trends and seize short-term trading opportunities.
Latest Articles
Stay ahead of the market.
Get curated U.S. market news, insights and key dates delivered to your inbox.


AInvest
PRO
AInvest
PRO




Comments
No comments yet