

AWS grew 37% from a year earlier in the June quarter — its fifth straight quarter of faster growth, on a 39.4% operating margin. In the same report, AmazonAMZN-- said it plans to spend roughly $220 billion on data centers and chips in 2026 and that its trailing free cash flow has gone negative. Both camps read the same two sentences. Bulls see the growth as proof the largest bet in the company's history is converting into value. Bears see the cash drain as the front page of a bill that arrives whether or not the cloud keeps accelerating. The whole duel comes down to one question: can Amazon's own silicon turn that spending into cash before depreciation and interest start compounding?
The facts both sides sign
Call this the shared record, the numbers neither camp disputes. AWS revenue was $42.2 billion in Q2 2026, up 37% year over year — the fastest pace in 18 quarters — after growth of 17%, 20%, 24%, and 28% in the four prior quarters. AWS operating income rose 64% to $16.6 billion, pushing segment margin to 39.4% from 32.9% a year earlier; the unit produced 60.5% of Amazon's operating income on just 21.1% of its revenue. AWS closed the quarter at a $169 billion annualized run rate with a $496 billion committed backlog growing triple digits. And the bill: Amazon lifted its 2026 capital-expenditure plan to roughly $220 billion from about $200 billion, while trailing free cash flow flipped to negative $7.6 billion from positive $18.2 billion a year earlier. Neither camp quarrels with any of it. They quarrel about what it means.
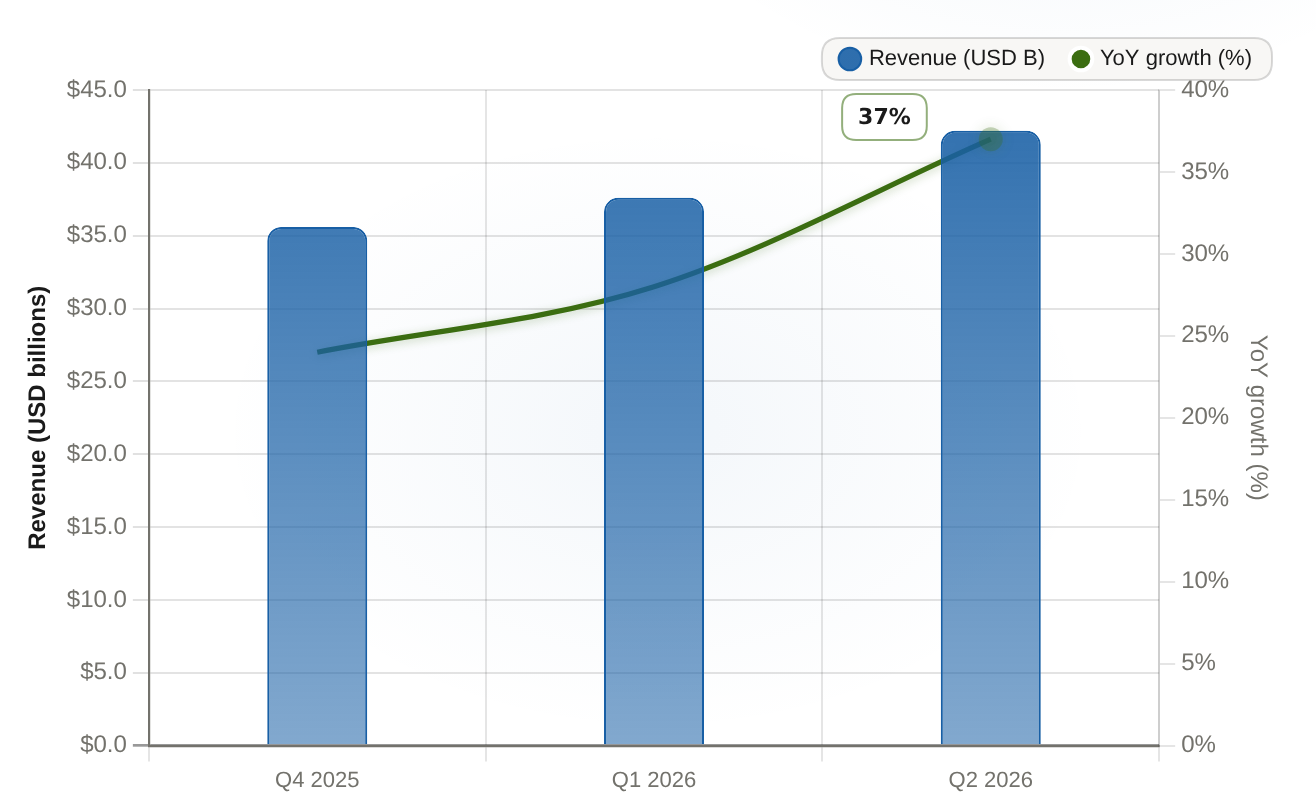
AWS revenue rose to $42.2B in Q2 2026 with YoY growth accelerating through 24% to 28% to 37%, underscoring the re-acceleration behind the custom-silicon bet.
| Period | Revenue (USD B) ($) | YoY growth (%) |
|---|---|---|
| Q4 2025 | 35.6 | 24 |
| Q1 2026 | 37.6 | 28 |
| Q2 2026 | 42.2 | 37 |
Bull's round: silicon turns capacity into margin
The bull's case is that the growth and the spending are the same story. AWS doesn't buy accelerators it doesn't think are needed, so the re-acceleration arriving in the same quarters the capacity was poured in is the tell that the build is earning its keep. The part of that story unique to Amazon — the piece a Microsoft or Alphabet can't copy the same way — is that Amazon makes its own silicon. Trainium accelerators, Graviton CPUs, and the Nitro networking layer sit at the base of the stack, so a workload that runs on them skips the merchant-chip markup that a GPU reseller collects. Management's claim is that this saves "tens of billions" in annual capex and delivers "several hundred basis points" of operating-margin advantage versus relying on outside chips for inference.
That last sentence needs its label attached: those figures are what Andy Jassy projects in the 2026 shareholder letter, not an independently measured bridge. What is reported is the scale of the silicon line. Jassy says the custom-chip business already runs at more than $20 billion in annualized revenue growing triple digits, and that were it monetized the way Nvidia's merchant business is, "our chips would be generating over $50 billion in annual revenue". Demand backs the story up in committed form: OpenAI committed more than $100 billion to AWS and consumes roughly two gigawatts of Trainium capacity, and multi-year, multi-gigawatt Trainium deals anchor the $496 billion backlog.
Run the mechanism and you see the bull's arithmetic. Self-supplying the accelerator and CPU removes the supplier's margin from the cost stack, which lowers what Amazon pays to serve a request. Lower serving cost is what lets it price competitively and still bank the 39.4% margin. Each $220 billion of capacity is thus not a generic bet on cloud demand but a bet that a growing share of the load lands on chips Amazon builds and sells to itself — captured margin, backed by signed demand. That is the "value-accretive" reading the hard numbers support even before management's projections.
Bear's round: the balance sheet is paying for the build
The bear doesn't dispute any of that and adds a ledger no one talks about in the growth story. Trailing-twelve-month purchases of property and equipment reached $169 billion, up 64%, and for the first time since 2022 Amazon is spending more than it generates: capex now runs at about 102% of trailing operating cash flow. Microsoft, Alphabet, and Meta all still fund their builds out of operations — at roughly 57%, 63%, and 61% respectively — making Amazon the only one of the four borrowing to bridge the gap. Long-term debt nearly doubled to $128.9 billion over six months, after Amazon sold $15 billion in bonds in November 2025 and another $24.9 billion in July 2026 to pre-fund the build and avoid draining cash if AI revenue disappoints before the wall lands.
The wall is the second half of the bear case, and it has a shape even the bull concedes exists. Reported depreciation lags cash capex by design, and Wall Street estimates a step-up hitting 2027 through 2029 no matter how fast the cloud grows. Amazon shortens the runway further: in January 2025 it cut some server and network useful lives back to five years, so its depreciation line is the most exposed of the hyperscalers. These dollar figures are directional and unverified — nobody has audited the exact understatement — but the direction of risk is real: the very margin the chip advantage builds is also the line the depreciation wave will press on. Add in that Q2's $62.6 billion net income was inflated by a $53.4 billion non-operating gain from revaluing the Anthropic stake, and the bear insists the operating engine, not the headline profit, is the only honest scorecard.
What the price already demands
Now price the two stories against each other instead of in isolation. The market has been discounting Amazon to about 12 times EV/EBITDA, under Alphabet's roughly 17 times, specifically for cash-conversion risk — the market is paying less per dollar of earnings than it pays peers precisely because it doubts the spend converts. The bull's case is that a re-acceleration this durable, with margin this high, closes that discount as free cash flow inflects.

There is one honest asymmetry in the evidence. The re-acceleration and the margin are reported and dated across five quarters — hard numbers. The custom-silicon share of that margin advantage is a management projection, carried as a claim. The funding gap and the debt are reported. The depreciation-wall arithmetic is modeled and directional. Both camps therefore rely on different kinds of certainty: the bull on what has already printed, the bear on what a schedule will do in two to three years. Whichever narrative you trust more, they agree on the deciding variable — whether AWS converts committed backlog into reported revenue and cash faster than the depreciation and interest compound.
The ruling
The business case goes to the bull with the strongest evidence attached to it yet: five consecutive quarters of acceleration, 39.4% margin, a $496 billion backlog, and a fully owned silicon stack that removes a supplier margin from the cost curve. The stock call is the hard one, because the price already pays for a great deal of that outcome and the funding is real. The margin and growth are not in dispute — but they are also inputs to a test Amazon has not yet passed, because the depreciation wave that would challenge them has not yet arrived. At this price the bull carries the burden of proof, and the ruling flips if two things show up together by late 2026: AWS quarterly growth slipping toward the low twenties while spending holds at the $200 billion-plus run rate, or AWS margin compressing toward roughly 30% as the depreciation step-up lands. The growth holds and the margin holds into 2027, and the bears were buying the wrong fear. Either way, the next earnings report — not a price target — is the event that moves the score.








Comments
No comments yet