
AIXI Rallies After Hours — But Is It A Real Breakout?
Why is the stock rising in the post-market session?
Xiao-I (Nasdaq: AIXI) stock is seeing a sharp post-market move of 5.59% as of 2026-03-19. The rally appears to be a breakout attempt from a months-long downtrend, though the catalyst remains unclear. No recent news or announcements have surfaced to explain the move, and the volume, while elevated, has not reached levels typically seen during strong breakouts. That said, the stock is trading near its 20-day range low, raising questions about whether this is a meaningful reversal or a false start.
The stock’s price action is being driven by short-term momentum, not fundamentals. With a micro-cap profile and limited daily liquidity, AIXIAIXI-- is highly sensitive to even modest swings in volume and order flow. Put differently, a few large trades can quickly shift the price in either direction.
The bottom line: This is a technical breakout attempt, not a fundamental-driven move. Retail and institutional traders alike should be cautious.
What technical levels are important for AIXI stock news?
From a technical perspective, AIXI is trading in a strong downtrend. The 20-day and 50-day moving averages are both above the current price, at $0.2179 and $0.2619, respectively. The RSI is at 12.66, suggesting oversold conditions. However, oversold readings in a strong downtrend are not reliable signals of a reversal.
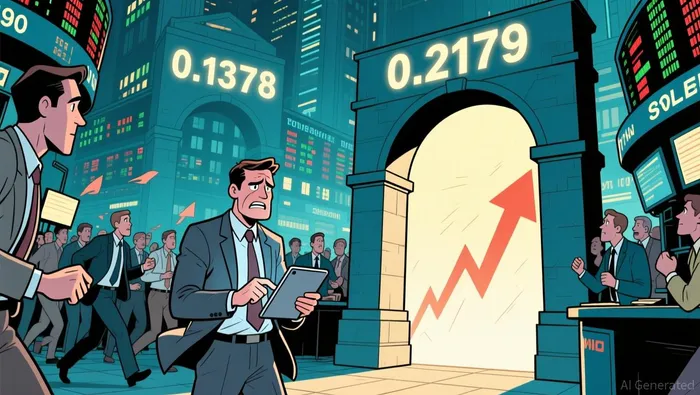
Key technical levels to watch are as follows:
- Nearest support is at $0.1378 (previous close), a level that has held in the past.
- Nearest resistance is at $0.2179 (20-day MA), which is a critical level to confirm any reversal.
AIXI is currently in a pending breakout pattern. The stock must hold above $0.17 (the 20-day range low) to confirm the move. Crucially, any failure to hold above this level would send the stock back into bearish territory.
By contrast, a successful break above $0.22 would be a strong signal of trend reversal, but such a move would require significantly stronger volume and participation.
What to watch for AIXI support and resistance levels?
The key to understanding AIXI’s next move lies in volume and price action. The stock has seen a relative volume spike, with today’s trading volume at 3.99 million shares, or 3.71 times the 20-day average. While this is a strong indicator, the volume is concentrated in a few bars, suggesting uneven participation.
In practice, the market is testing the strength of the breakout. Traders should watch the next few sessions for confirmation of the pattern. If the stock holds above $0.17 and shows follow-through volume, it could signal a trend reversal. On the flip side, a quick retest of $0.14 would confirm a failure scenario.
To put numbers on it, a move below $0.14 would be a critical breakdown level, likely increasing the probability of a failure or reversal scenario. Any follow-through above $0.22, however, would be a strong bullish signal.
In short, this is a high-risk, high-uncertainty scenario. AIXI stock news highlights a stock in technical flux, where one strong session can change the story completely. Investors should monitor volume, price action, and the 20-day support level as key signals for what comes next.
Stay ahead of the market.
Get curated U.S. market news, insights and key dates delivered to your inbox.
AInvest
PRO
AInvest
PRO
Comments
No comments yet