
Ainvest Option Flow Digest - 2026-03-27: NVDA's $70M Income Harvest, AMZN's $25M Directional Bet, and 7 More Institutional Signals Totaling $113.8M
$113.8M institutional flow across 9 tickers. NVDA $70.3M call overwrite on 12.8M shares is the largest single-day position of the week. AMZN $25.4M diagonal spread, SNDK $10.5M bear put spread, and MU $2.8M moonshot call at $570. Full breakdown inside.
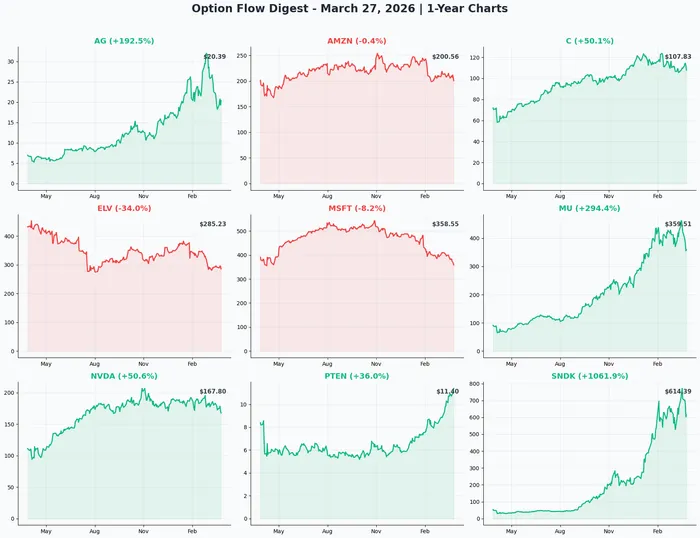
Friday, March 27, 2026 | Unusual Options Activity Report
Today's tape delivered one of the largest single-day institutional flow readings of 2026. Nine names. $113.8 million in combined premium. One giant covered call ladder on NVDA that dwarfs everything else. Here is everything you need to know.
Today's total unusual premium: $113.8M across 9 tickers
The headline is NVDA, which alone accounts for 62% of today's flow — a $70.3M covered call ladder on an estimated 12.8 million shares, executed in a single coordinated sweep at 10:02 AM. Below the fold: a $25.4M diagonal spread on AMZN betting on a 10%+ rally before June, a $10.5M bear put spread on SNDK hedging a NAND supercycle that's already up 550%, and six more signals ranging from a $5.1M oil services conviction bet to a $1.3M silver accumulation play entering its second consecutive day.
Today's Flow at a Glance
1. 🟢 NVDA — $70.3M Covered Call Ladder on 12.8M Shares
At exactly 10:02:34 AM, a single institutional desk sold 128,000 NVDA call contracts simultaneously across four strikes — all June 18, 2026 expiration — collecting $70.3M in premium. This is not four separate trades. The identical timestamp, MID fills, and 32,000-contract allocation to each leg are the fingerprints of a programmatic block execution.
The mechanics: four tranches of 32,000 contracts at $180, $190, $200, and $210 cap the upside on an estimated 12.8 million underlying shares (~$2.16B in stock). In exchange, $70.3M in cash lands today.
What it tells you: This institution is not bearish on NVDA's long-term story. With $68.1B in Q4 FY2026 revenue (+73% YoY), a $1 trillion order pipeline through 2027, and the Vera Rubin platform just unveiled at GTC, the fundamentals are intact. But they also see NVDA stuck below $170-$180 gamma resistance through June — and they'd rather collect 3.25% cash yield (roughly 14% annualized) on their massive position than wait for a breakout that may not arrive before the June 18 expiration.
The lowest strike, $180, sits at the heaviest call gamma resistance level in the entire NVDA options chain. That is not a coincidence. At $168.70 today, the stock needs a 6.7% rally just to test the first covered call leg. The options market prices the June implied upper range at $187.54 — meaning only a strong Q1 FY2027 earnings beat on May 27 has a realistic shot at pushing any of these legs in-the-money.
The key date: May 27, 2026 — Q1 FY2027 NVIDIA earnings. That is the one event inside this expiration window that could test the $180 strike. If NVDA beats $78B guided revenue and raises Q2 guidance to $85B+, the call ladder gets tested. Everything else — hyperscaler capex reports, Vera Rubin deployment updates — matters only insofar as it sets the stage for that print.
For NVDA holders: This is the institutional template for a covered call program. The June $175 strike (3.7% above current price) offers similar premium logic at a more retail-friendly scale. If NVDA stays below $175 through June, you collect income. If it gets called away, you sell at a profitable level. The $70.3M whale just showed you the playbook.
2. 🟢 AMZN — $25.4M Diagonal Spread, Betting $225 by June
Eleven fills. One 60-second window. $25.4M in a diagonal call spread that buys 25,000 June $225 calls and simultaneously sells 22,500 August $260 calls. Z-scores on the buy legs range from 4.5 to 39.7 standard deviations above average — the kind of statistical outlier that appears a handful of times per year in any single contract.
AMZN is at $202.06 today, down 10.7% YTD after the February capex shock ($200B in 2026 AI infrastructure commitment) cratered the stock 8-10% in a single session. But the analyst community disagrees with the market: average consensus target sits near $279, 38% above where the stock trades today.
The structure: Buy the near-dated, lower-strike calls (June $225, need 11.3% rally). Sell the longer-dated, higher-strike calls (August $260) to collect $8.7M in premium and cut the net cost roughly in half. Net debit works out to approximately $2.83 per spread — AMZN needs to reach $227.83 by June 18 for the trade to be profitable at expiration.
Why this construction? Three signals in one: (1) the trader expects a meaningful rally before June 18; (2) they do not expect AMZN to reach $260 by August, so selling that upside is "free money" in their view; (3) several of the sell legs show close signals, suggesting this partially recycles an existing $260 position into fresh near-term $225 exposure — a tactical repositioning toward lower-strike, near-term upside.
The catalyst stack: Amazon's $50B exclusive enterprise cloud partnership with OpenAI (making AWS the home for OpenAI Frontier), a $200B capex commitment that the market punished as overspending but which locks in AWS market share for years, and Project Kuiper satellite internet (Amazon Leo) facing an FCC commercial service deadline in 2026. Q1 2026 earnings are the most likely catalyst inside the June 18 window.
The real risk: $200 is the single strongest put gamma support level in the AMZN chain. The stock is essentially balancing on that level right now. Every $5 increment between here and $225 carries its own gamma resistance wall. Getting to $225 means breaking through five successive ceilings — doable with a strong earnings catalyst, but not a given.
3. 🔴 SNDK — $10.5M Bear Put Spread, Fading a 550% Supercycle
SanDisk spun off from Western Digital in February 2025 at roughly $28 per share. Fourteen months later it hit $777.60. Today it is at $624.75 — still up 550%+ but 21% off the all-time high, and today it briefly touched $599 intraday before recovering. That $599 print is relevant: it happened on news of Google's TurboQuant, an AI memory compression algorithm that markets are beginning to price as a structural risk to NAND demand.
Into that environment, one institutional player dropped a $10.5M bear put spread at 11:13:55 AM — simultaneously buying 325 contracts of the November $620 puts ($5.8M) and selling 325 contracts of the November $560 puts ($4.7M). The $620 put long leg had zero open interest before this trade. This is entirely fresh capital taking a new bearish position.
The mechanics matter: Both legs are deep in-the-money puts. That choice is deliberate — deep ITM puts have high delta (~0.85-0.95) and low time decay. This is a directional bet, not a volatility play. The trader pays $34.70 net per spread for a $60-wide position. Breakeven at expiration is $585.30 — only a 6.3% decline from today's $624.75. Maximum profit of $25.30 per spread (73% ROI) if SNDK closes at or below $560 on November 20.
What makes this compelling as a bearish thesis: SNDK guided Q3 FY2026 revenue to $4.4B-$4.8B with $12-$14 non-GAAP EPS. That is a sky-high bar. Enterprise SSD contract prices rose 53-58% QoQ in Q1 CY2026 — the steepest quarterly increase in history. But memory cycles do not stay at peak pricing indefinitely, and the analyst community has begun flagging cyclical oversupply risk emerging as early as CY2027-2028. At a 7.49x forward P/E SNDK is not expensive on current estimates, but current estimates embed pricing assumptions that may be hard to sustain.
The important nuance: This could be a hedge, not a directional short. A long SNDK holder who bought at $400 insuring a portion of gains against a peak-cycle reversal is a perfectly rational explanation for this trade. In that framing, the bear spread wins if the stock falls but is simply insurance if it does not.
Mark the calendar: May 13, 2026 — Q3 FY2026 SanDisk earnings (after close). That is the most critical event for this position. A miss or conservative guidance on NAND pricing trajectory is the trigger that makes this trade work.
4. 🟢 PTEN — $5.1M Double-Tap on Oil Services Calls
Patterson-UTI Energy is North America's largest integrated drilling and completions provider — 172 super-spec drilling rigs and 3.3 million hydraulic fracturing horsepower. It is the pure pick-and-shovel play on U.S. oil production. And today, one buyer put $5.1M into August $12 calls with a technique that signals serious conviction.
First fill at 10:48:05 AM: 19,438 contracts at $1.62, executed at MID (institutional negotiation). Total: $3.1M.
Second fill at 11:25:12 AM — 37 minutes later: 12,635 contracts at $1.55, executed at the ASK (urgency, willing to pay full ask). Total: $2.0M.
That progression from MID to ASK is the tell. The buyer already got their first fill at the negotiated midpoint. Then they stepped up to the offer on the second fill because they wanted the position regardless of the extra cost. Combined Vol/OI ratio: 73x. There were 437 contracts of open interest in the August $12s before this session. The buyer created 32,073.
The thesis in one sentence: WTI crude at $94.48/bbl, driven by Iran's rejection of U.S. peace negotiations and Strait of Hormuz disruption, combined with PTEN's Q4 beat (-$0.02 EPS vs -$0.12 consensus) and 25% dividend hike, sets up an H2 2026 rig count recovery that this buyer wants to own before it happens.
The key number to watch is $12.00. That is both the strike and the primary call gamma resistance level. Once PTEN breaks and holds above $12, the dealer hedging dynamic flips — market makers who are short gamma at $12 must buy stock as price rises toward their strike, creating a self-reinforcing upward push. Above $12, the $13 resistance is significantly thinner.
The risk is real: WTI at $94 is a geopolitical premium, not a fundamental one. The EIA's base case without Hormuz disruption has WTI averaging $51/bbl in 2026. PTEN CEO Andy Hendricks has said explicitly that higher oil prices take 6+ months to translate into rig activity. And multiple directors sold shares in March. The oil price is the puppet master here — if Iran de-escalates, this trade is in trouble.
Q1 earnings on April 22, 2026 are the first major checkpoint. That is three and a half weeks away.
5. 🟢 MSFT — $3.3M Deep OTM Put SELL, "Not Going to $250"
MSFT is at $356.86 today, down 31% from its October 2025 all-time high of $539.83. The January 29 earnings reaction was brutal — the stock fell 10% in one session, erasing $357B in market cap, despite posting $81.3B in revenue (+17% YoY), Azure at 39% growth, and a $625B commercial backlog. Investors panicked over $37.5B in quarterly capex (+89% YoY). The stock has not recovered.
Into that setup, at 10:09:35 AM, a single seller unloaded 9,747 August $250 put contracts for $3.42 each, collecting $3.3M in premium. Vol/OI ratio: 19.5x against only 513 contracts of existing open interest.
What this trade is saying: For this put seller to lose money, Microsoft — a $2.72 trillion company with $625B in contracted future revenue and Azure growing at 39% — would need to fall below $246.58 by August 21. That is a 31%+ crash from today's price. The last time MSFT traded at $250 was during the COVID-era 2022-2023 bear market trough.
The seller is not saying MSFT will rally. They are saying it absolutely will not collapse 30% in five months. They are the insurance company, collecting premium for coverage against a catastrophe they consider structurally implausible given the company's contracted revenue backlog.
The options market agrees with this framing: Even the most bearish implied move scenario for August puts MSFT's lower range at $316.84 — still $67 above the $250 strike. This put sits below the 1-standard-deviation lower bound of where the market thinks MSFT can go. It is tail-risk premium collection.
The real risk for this trade is concentrated in one date: April 28, 2026 — Q3 FY2026 MSFT earnings after close. If MSFT misses on Azure growth AND capex guidance surprises to the upside again, the stock could see another January 29-style air pocket below $320. Even that scenario keeps MSFT $70 above the $250 strike, but the psychological damage could push things further.
Context for retail: Replicating a $3.3M naked put position is not appropriate at retail scale without understanding the margin requirements. The retail-friendly version is a bull put spread — sell the August $310 puts, buy the August $290 puts, collect $3-4 net credit, cap the max loss at $16-17.
6. 🟢 MU — $2.8M at $570, 56% OTM with Records Just Printed
Nine days ago, Micron reported the most extraordinary quarterly numbers in memory chip history: $23.86B revenue crushing $20.07B consensus by $3.8B, $12.20 non-GAAP EPS versus $8.60 expected, 74.4% gross margins up from 36.8% a year earlier, $6.9B in quarterly free cash flow, and Q3 guidance of $33.5B — nearly double what the Street expected before the report. The stock hit an all-time high of $471.34 on earnings day.
Then it sold off 23%.
Today Micron is at $364.30 — punished for a $25B+ capex commitment, Google's TurboQuant memory compression fears, and Iran-driven macro pressure on growth multiples. None of those concerns touch the fundamental story: HBM4 production for NVIDIA's Vera Rubin is ramping, HBM capacity is sold out through end of 2026, and DRAM prices rose 90-95% QoQ in Q1 CY2026 with another 20% hike expected next quarter.
At 12:17:33 PM, someone bought 1,000 contracts of the November $570 calls at $28.15 each. Total: $2.8M. Strike is 56% above spot. Breakeven at expiration is $598.15 — a 64% rally from today's $364.30.
The conviction behind this trade: Cantor Fitzgerald has a $700 price target on MU. Raymond James sits at $530. Wedbush at $550. The consensus average across 28-30 analysts is approximately $536. The $570 strike lands squarely between consensus and Cantor's bull case. This is not a number someone invented — it sits in the range where the Street's most bullish models say MU belongs.
The risk is explicit: The options market prices MU's November implied upper range at $479.66 — the $570 strike is $90 above that. This trade requires MU to go beyond what the options market considers a 1-standard-deviation upside move by November. The probability at expiration is approximately 10-15%. The buyer knows this. They are making a specific bet that Q3 earnings (guided at $33.5B, late June) forces a violent re-rating that the market currently refuses to price.
The leverage math: At Cantor's $700 target, the $570 calls would be worth roughly $130. On a $28.15 purchase, that is a 4.6x return on $2.8M. That math requires everything going right: Q3 delivers, Samsung does not recapture HBM share, Google TurboQuant proves a non-event, and macro cooperates.
7. 🟡 ELV — $2.6M Covered Call, Getting Paid to Wait Through the Mess
Elevance Health is the second-largest U.S. health insurer by membership — 45 million members across Medicaid, Medicare Advantage, and commercial Blue Cross Blue Shield plans in 14 states. The stock has dropped 37% from its 2024 all-time high of $544 and sits at $284.89 today, barely above a 52-week low of $273.71.
The catalyst stack that caused the damage: Q4 2025 earnings delivered a 2026 EPS guide of $25.50 adjusted — 16% below 2025's $30.29 and well under consensus of $27.21. Then on March 2, CMS sanctioned Elevance for failing to submit Medicare Advantage risk adjustment data through electronic systems for seven consecutive years (they used flash drives instead, despite repeated regulator warnings). New MA enrollment is frozen effective March 31. The stock dropped 8%+ the day sanctions were announced.
At 12:42:41 PM, a large holder sold 948 June $280 call contracts at $27.00 each, collecting $2.6M. The $280 strike is slightly below current price ($284.89) — this is an in-the-money covered call. Vol/OI ratio: 25x against just 64 contracts of existing open interest. Z-score: 202.51, one of the highest of the day.
What this trade communicates: The seller owns ELV stock and is explicitly saying they do not expect a breakout above $307 (the $280 strike plus $27 premium) before June 18. In exchange for capping that upside, they collect $27/share — 9.5% of the stock's current value in 83 days, roughly 42% annualized. The $27 premium also creates a $27 downside buffer, dropping their effective cost basis from $284.89 to $257.89. A move to $260 — which the implied move range considers possible — would be fully offset by the collected premium.
The most important near-term date: April 21-22, 2026 (estimated) — Q1 2026 ELV earnings. The market is watching one number above all others: the Medical Loss Ratio. Q4 2025 came in at 93.5%. Management's full-year 2026 target is 90.2%. If Q1 shows MLR trending back toward 90%, the recovery thesis gains traction. If MLR stays elevated, the stock tests the $254 lower implied range — which sits disturbingly close to the $273.71 52-week low.
TD Cowen has ELV as their "Best Idea for 2026" with a $400 target. The median analyst target across 21 analysts is $398 — 40% above current price. The discount to peers (12.68x forward P/E vs. 15.54x industry average) is real. But this covered call seller is making the pragmatic choice: collect income now, let the catalysts play out, and revisit the bull case when the evidence arrives.
8. 🟢 C — $2.0M Pre-Earnings Bet on a $115 Breakout
Citigroup is at $108.12 — down 11% from its 52-week high of $125.16 but still up 61% over the past year as Jane Fraser's multi-year transformation approaches 80% completion. Two weeks ago BlackRock selected Citi to provide middle-office services for $4.0 trillion in U.S.-domiciled iShares ETFs on the Aladdin platform. This morning, Jefferies upgraded Citi to Strong Buy with a $135 price target.
On the same day as that Jefferies upgrade, at 12:39:50 PM, a buyer purchased 9,998 April $115 call contracts at $1.96 each. Total: $2.0M. Vol/OI: 1.45x. Z-score: 15.0. This is fresh capital entering a brand-new position, not a roll or a hedge.
The binary in this trade is completely transparent: Q1 2026 Citigroup earnings are on April 14 — three trading days before the April 17 expiration on these calls. The trader is paying $1.96/share to own the $115 strike for 21 days, with a $116.96 breakeven. They need an 8.2% rally from today's price — through the dominant $110 gamma wall (26.7B call gamma, the largest single resistance level on the board) and up to $115 — within three weeks, driven primarily by a strong earnings print.
Why $115? The strike aligns with three separate signals simultaneously: it is the largest call gamma resistance level in the chain, it sits just inside the April implied upper range of $116.89, and it matches the median analyst price target of $115. The buyer was not random in their strike selection.
What needs to go right: EPS above $2.60 consensus, ideally with revenue above $22.99B to avoid the Q4 pattern (EPS beat + revenue miss = stock drops). Management needs a confident tone on consent order progress and Q2 guidance. The BlackRock mandate's first-quarter revenue contribution exceeding expectations would be a bonus.
What can go wrong fast: The $110 gamma wall is formidable. With 26.7B in call gamma, market makers are effectively selling stock as price approaches $110. Getting through $110 requires a genuine beat, not just a meet. If earnings disappoint — even slightly — these calls expire worthless in three days. This is explicitly a defined-risk lottery ticket.
9. 🟢 AG — $1.3M Silver Call, Day 2 of Accumulation
First Majestic Silver dropped $1.3M on AG $25 December calls today at 10:04:51 AM — 3,106 contracts at $4.15 each, purchased at the ask. With 28,000 contracts of existing open interest at this strike, volume-to-OI ratio is 0.18 and Z-score is 3.21, flagging this as a statistically rare event. What makes today's print notable: this is the second consecutive day that the same $25 December strike has seen aggressive at-ask buying. Back-to-back accumulation at the same strike and expiration is not noise.
The setup: Silver crashed 44% from its January all-time high of $121.64/oz to approximately $68/oz today. AG mirrored that move, falling 29% in just seven trading sessions from $32.03 to $19.67. The stock is still up 162% from its March 2025 lows — AG has already proven its ability to make explosive moves when silver cooperates.
The bull case in numbers: JP Morgan's silver price target for 2026 is $81/oz. Average analyst price target on AG shares is $24.58 — 25% above current price. The $25 call strike implies a 27% rally from today's $19.67. If silver recovers toward $80-85/oz, that move is consistent with historical AG behavior as a leveraged silver proxy.
Why the fundamental floor is credible: AG closed 2025 with $937.7M in cash, record production of 15.4M oz silver (+84% YoY via the Gatos Silver acquisition), and revenue of $1.257B (+124% YoY). At $68/oz silver against $27/oz all-in sustaining costs, margins remain positive. The company is not broken at this silver price — it is just less profitable than at $121/oz.
The breakeven math for the call buyer: $25 strike + $4.15 premium = $29.15 by December 18. A 48% rally from today's $19.67. That requires silver recovery AND multiple operational catalysts: Q1 earnings on May 13 (first test of "margin over volume" strategy), Santa Elena Mill expansion confirmation, Los Gatos throughput increase in H2. The December 18 expiration captures every single 2026 catalyst on the calendar.
The pattern: When the same strike and expiration sees aggressive at-ask buying on back-to-back days, that typically reflects deliberate position building rather than opportunistic trading. The question is not whether the thesis is risky (it clearly is), but whether the accumulation pattern signals a larger institutional view on silver's path through year-end.
Expiration Timeline
Understanding when each trade's thesis gets tested:
April 17, 2026 — Monthly OPEX (21 days) - C $115 call expires three days after April 14 earnings — the entire $2.0M lives or dies on Q1 Citi results
June 18, 2026 — Quarterly OPEX (83 days) - NVDA $180/$190/$200/$210 covered call ladder — 128,000 contracts; the May 27 earnings print is the key variable - AMZN $225 calls (buy leg of the diagonal spread) — needs a 12.8% rally to reach breakeven - ELV $280 covered call — captures April Q1 earnings and early CMS sanctions data
August 21, 2026 — Quarterly OPEX (147 days) - AMZN $260 call (sell leg of the diagonal) — the hedge on the AMZN structure - PTEN $12 call — captures Q1 earnings (April 22), Q2 earnings (late July), and H2 rig guidance - MSFT $250 put (short) — captures Q3 earnings (April 28), E7 launch (May 1), Build 2026 (June 2-3)
November 20, 2026 — Quarterly OPEX (238 days) - SNDK $620/$560 bear put spread — spans Q3 and Q4 NAND earnings; May 13 Q3 report is the first major test - MU $570 call — spans Q3 earnings (late June, guided $33.5B revenue), the thesis-defining moment
December 18, 2026 — Monthly OPEX (266 days) - AG $25 call — captures Q1 (May 13), Q2, Santa Elena expansion, Los Gatos throughput, and Jerritt Canyon potential
Who Is Placing These Trades?
Today's flow reflects four distinct institutional profiles:
The Income Harvester — The NVDA and ELV covered call sellers. These desks own large stock positions and systematically sell calls to generate yield while waiting for the next leg higher. The NVDA trade generates 14% annualized on a $2.16B position. The ELV trade generates 42% annualized on whatever underlying position backs those 948 contracts. Neither trade is bearish on the long-term story — both are pragmatic about near-term price ceilings.
The Asymmetric Bettor — MU $570 calls, PTEN $12 calls, AG $25 calls, C $115 calls. These traders are paying defined premiums for exposure to specific catalysts. Full loss is possible (and probable for the $570 MU calls). But the payout structure on a correct outcome — 4-5x on MU if Cantor's target materializes, 87% on PTEN if oil holds and the rig count inflects — justifies the lottery-ticket characterization only if you ignore the underlying fundamental analysis. These buyers did their homework.
The Structural Bull — The MSFT put seller and the AMZN diagonal spread. Both trades express high conviction that the near-term capex shock selloffs in mega-cap tech are overdone. The MSFT put seller is being paid to believe a $2.72 trillion company with $625B in contracted backlog won't fall 31% by August. The AMZN diagonal spread is a cost-efficient way to own the thesis that AWS + OpenAI + $200B capex creates a $225+ stock by June.
The Cycle Skeptic — The SNDK bear put spread. One institutional player looked at a stock that's up 550% in 14 months, printing record NAND pricing, guiding to $12-$14 EPS next quarter — and decided the risk is tilted to the downside from here. Maybe it is a hedge on an existing long. Maybe it is a fresh directional short. Either way, it is $10.5M of capital saying the easy money in NAND flash has been made.
Risk Control Framework
Every trade in today's digest involves potential total loss of the premium paid (or, for covered call writers, the opportunity cost of missing upside beyond the strike). Here is the framework for thinking about these positions:
Highest binary risk: C $115 April calls (21-day window, 6.4% OTM, earnings binary) and PTEN $12 calls (oil price as the single dominant variable). Both trades expire worthless if the specific catalyst does not materialize on schedule.
Longest time runway: AG $25 December calls (266 days) and MU $570 November calls (238 days) give the thesis the most time to develop. Time is both an asset (more catalysts can occur) and a cost (daily theta decay on far-OTM options accumulates aggressively).
Defined risk, both directions: SNDK $620/$560 bear put spread — net $34.70 per spread is the maximum loss, $25.30 per spread is the maximum gain. The 73% ROI potential on a 6.3% underlying move is the most efficient risk/reward structure in today's batch.
Tail risk in the income trades: The NVDA covered call seller loses nothing on the calls if NVDA stays flat or falls — but loses 12.8 million shares' worth of upside above $180 if the stock rallies sharply on May 27 earnings. The premium covers only the first $70.3M of foregone upside. A similar dynamic applies to the ELV covered call: a quick resolution of CMS sanctions plus a strong Q1 MLR print could push the stock toward $315, leaving the covered call writer watching $35/share of upside vanish above their $307 effective breakeven.
General principle: Options trading involves substantial risk and is not suitable for all investors. You can lose 100% of premium paid. Past unusual options activity does not guarantee future price movements. This digest is for informational and educational purposes only and does not constitute financial advice.
Catalyst Calendar
Key dates from today's trades through December 2026:
🏆 The Bounty Program — Ainvest x TradeStation Collaboration
Guaranteed $150 Visa Gift Card + Up to $5,000 in Stackable Bonuses
📌 How it works: 1. Open a new TradeStation account through Ainvest's exclusive link 2. Fund with $2,500+ opening balance 3. Make your first trade — any ticker, any size
🎁 What you get: - Guaranteed $150 Visa Gift Card - Stackable cash bonuses:
30-day verification. New TradeStation customers only.
Sponsored collaboration between Ainvest and TradeStation
Disclaimer: This newsletter is for informational and educational purposes only. Options trading involves substantial risk of loss and is not suitable for all investors. You can lose 100% of the premium paid on options positions. Past unusual options activity does not guarantee future price movements. Nothing in this digest constitutes financial advice. Always conduct your own research and consult a licensed financial advisor before trading. Ainvest does not hold positions in the securities discussed unless disclosed separately.
Ainvest Option Flow Digest is published daily, analyzing institutional options positioning to help retail traders understand smart money flows. Subscribe for daily updates and in-depth analysis.
Latest Articles
Unlock Market-Moving Insights.
Subscribe to PRO Articles.
Already have an account? Sign in
Unlock Market-Moving Insights.
Subscribe to PRO Articles.
Already have an account? Sign in
Stay ahead of the market.
Get curated U.S. market news, insights and key dates delivered to your inbox.


AInvest
PRO
AInvest
PRO