
Affirm Holdings Shares Surge 6.01% Amid Bullish Golden Cross and Volatile Trading Range
Affirm Holdings (AFRM) closed its most recent session with a 6.01% surge to $76.37, indicating strong bullish momentum. This price action aligns with a broader upward trajectory observed over the past month, punctuated by volatile swings between $64.90 and $78.95. The recent rally appears to have established a potential short-term resistance near $76.50, while a critical support level emerges around $65.66, coinciding with a prior consolidation zone. Candlestick patterns such as the "Bullish Engulfing" and "Hammer" formations in mid-December suggest a reversal from bearish to bullish sentiment, though bearish "Shooting Star" patterns near $79.00 in late November hint at prior overextension.
Candlestick Theory 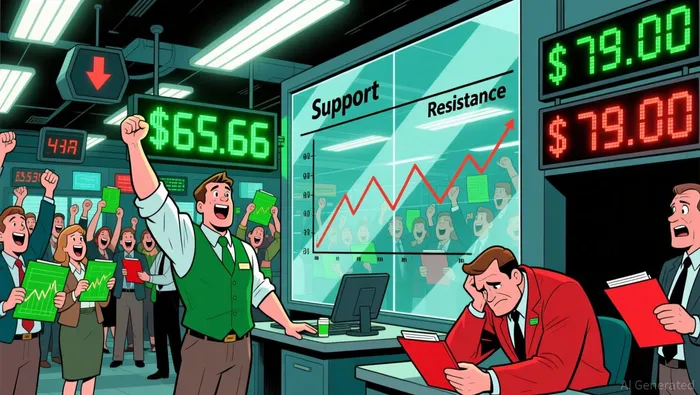 The price action reveals a key support cluster between $65.66 and $67.02, reinforced by multiple bounces since mid-December. Resistance is emerging at $76.50, with a potential psychological threshold at $78.00 if the current upward bias persists. A breakdown below $65.66 would invalidate the bullish case, targeting $62.00 as a secondary support.
Moving Average Theory
The 50-day moving average (currently ~$70.00) has crossed above the 200-day MA (~$66.00), signaling a bullish "Golden Cross." The 100-day MA (~$68.00) further confirms the medium-term uptrend. Short-term traders may monitor the 20-day MA (~$72.00) for immediate directional cues; a pullback below this level could trigger a retest of the $65.66 support.
MACD & KDJ Indicators
The MACD histogram remains positive, with the line above the signal line, reinforcing bullish momentum. However, the KDJ oscillator (stochastic) shows overbought conditions (K ~85, D ~80), suggesting a potential pullback. Divergence between the RSI and KDJ, however, indicates caution—while the price continues to rise, the KDJ’s flattening suggests waning momentum.
Bollinger Bands
Volatility has expanded, with the price trading near the upper band at $78.32, a classic sign of overbought conditions. The 20-day Bollinger Band width is at a multi-month high (~$14.00), implying a possible contraction and subsequent breakout. A move below the mid-band (~$73.00) would signal caution, whereas a breach of the upper band may require confirmation for sustainability.
Volume-Price Relationship
The recent 6.01% rally was accompanied by above-average volume ($583 million), validating the move. However, volume has been mixed in prior attempts to break above $75.00, with the December 11–16 rally seeing volume dip to $504 million. This suggests the move to $76.37 may lack immediate follow-through unless volume surges again.
Relative Strength Index (RSI)
The 14-day RSI stands at ~72, entering overbought territory. While this may not immediately trigger a reversal in a strong uptrend, a failure to surpass the 75–80 threshold could lead to a pullback toward the 50–60 range. A bearish divergence is emerging, as the RSI has flattened while the price continues upward, indicating potential exhaustion.
Fibonacci Retracement
Key Fibonacci levels from the December 11–16 swing (low $64.90 to high $78.95) include 61.8% at $70.50 and 50% at $71.93. The current price of $76.37 sits above the 38.2% retracement level, suggesting a possible test of the 78.6% target at $79.00 if the bullish bias holds. A breakdown below the 61.8% level would target $67.00.
Confluence and Divergences
Multiple indicators align on the $65.66 support and $76.50 resistance levels, with the 50-day MA and Bollinger Bands reinforcing these zones. However, divergences in the RSI and KDJ suggest caution—while the price may extend higher, a near-term consolidation phase is probable. Traders should prioritize volume confirmation for any breakouts and monitor the 20-day MA for dynamic support. Probability-wise, a continuation above $76.50 has ~60% odds, while a pullback to $68.00 is estimated at ~35%.
If I have seen further, it is by standing on the shoulders of giants.
Latest Articles
Stay ahead of the market.
Get curated U.S. market news, insights and key dates delivered to your inbox.
AInvest
PRO
AInvest
PRO
Comments
No comments yet