Affirm's Biggest Pre-Earnings Stat Is From May. At ~64x Earnings, the Print Decides

Wednesday, Aug 26, 2026 12:24 am ET2min read
AFRM--
Aime RobotAime Summary

- Affirm's Aug 27 fiscal Q4 report relies on outdated Q3 data (May 7) showing 146% YoY card volume growth and 4.4M active cardholders.

- The stock trades at 6.6x trailing sales (vs. 1.56x for PayPal) and 68x trailing earnings, the highest multiples in its peer group.

- Market demands continued outperformance: AffirmAFRM-- has beaten non-GAAP EPS by 76.5%+ for four quarters, but Q4 must exceed $0.33 EPS and $1.11B revenue to justify valuations.

- The print will determine if the 64x earnings multiple shrinks or expands based on Q2 results and 2027 guidance, making Aug 27 critical for valuation validation.

AffirmAFRM-- reports fiscal Q4 after the close on Aug 27, and the number leading the story is not new. The $2.13 billion in Affirm Card volume, up 146% year over year is fiscal Q3 data. So is the 4.4 million active cardholders behind it — more than double a year ago. Both were reported May 7 for the fiscal third quarter that ended March 31, three months before the market gets to see what happened in April, May, and June. That disconnect matters because the market has already graded this report card. Ainvest data shows the stock up 53.7% over the past 120 days to roughly $78, about 16% under the $93.20 52-week high it set this past year. The prevailing read ahead of the print is constructive. Zacks frames the quarter around higher GMV and more consumers and pegs the bar at non-GAAP EPS of $0.33 on revenue of $1.11 billion, up 65% and 26% year over year, while TipRanks carries the shares as a Strong Buy with a $93.41 average target. Here is what that price now demands. Ainvest data puts Affirm's trailing sales multiple at 6.6x on a $26.1 billion market cap, and its trailing earnings multiple near 68x — the richest of the group on sales. Against the consensus non-GAAP EPS of $1.22 for fiscal 2026 — the year that ended June 30 and gets filed in this very print — the stock costs about 64x earnings ($77.95 divided by $1.22). That is not a forward multiple on growth to come; it is a price on a fiscal year that is already over.
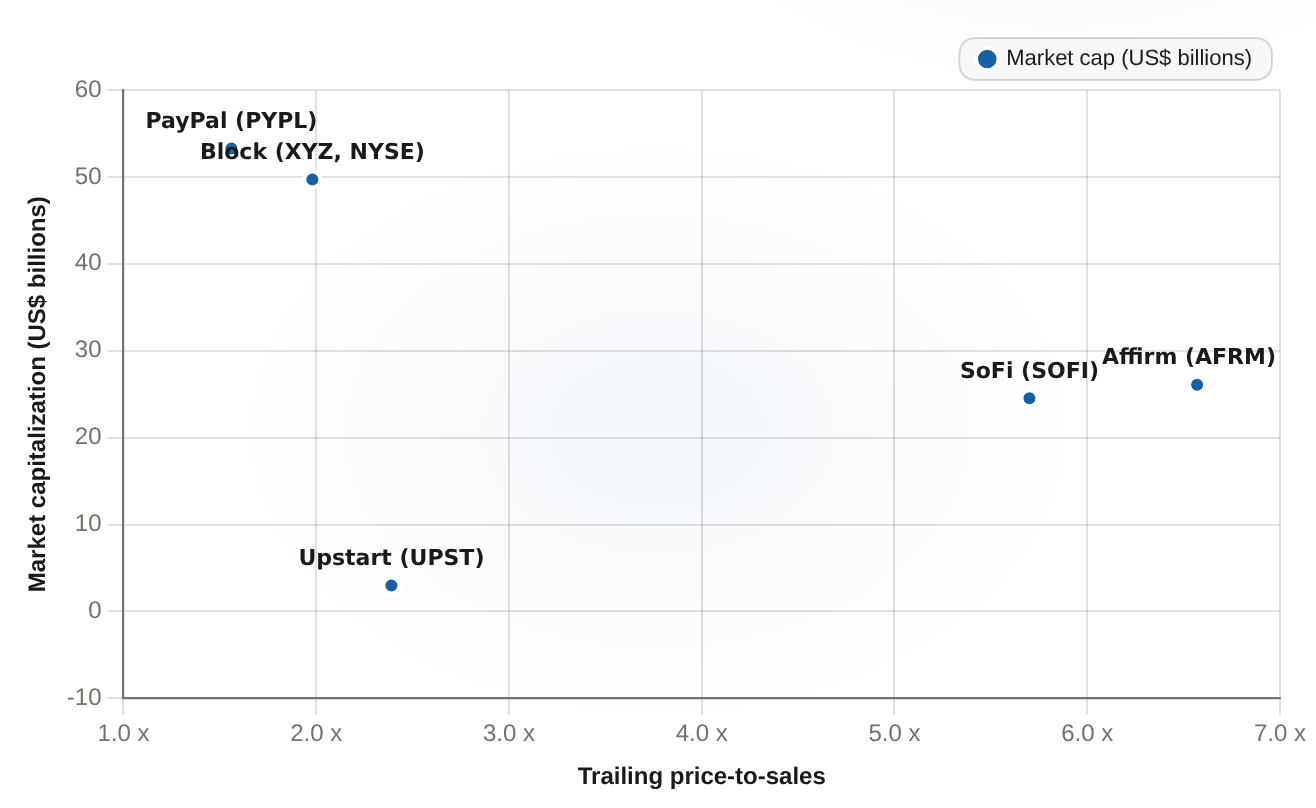
AFRM vs peers: trailing price/sales and market cap Trailing price-to-sales and market capitalization, cross-company snapshot at 2026-08-25
AFRM vs peers: trailing price/sales and market capTrailing price-to-sales and market capitalization, cross-company snapshot at 2026-08-25

AFRM trades at 6.57x trailing sales, the richest multiple here and roughly 3-4x the 1.56x (PayPal) and 1.98x (Block) of much larger established peers, so the valuation multiple - not the recycled card-growth headline - is the binding constraint into the Aug 27 print.

CompanyTrailing price-to-sales (x)Market cap (US$ billions)
Affirm (AFRM)6.5726.1
Upstart (UPST)2.392.98
SoFi (SOFI)5.724.54
PayPal (PYPL)1.5653.27
Block (XYZ, NYSE)1.9849.7
Every comparable is cheaper on sales, and cheaper on the earnings metric the market grades each of them on. PayPal trades at 1.56x sales and about 11x trailing earnings; Block at roughly 2x sales and the disclosed ~34x forward earnings Wall Street uses in place of its 139x trailing print; Upstart at 2.4x sales and ~49x earnings; SoFi at 5.7x sales and ~39x trailing earnings — barely half of Affirm's. The market is paying three to four times PayPal's and Block's sales multiple, and about 2.7x Upstart's, for the same consumer-credit growth story. That premium is a bet the delivered story keeps compounding — and fiscal Q3 is the evidence the bet is drawn from. Gross merchandise volume (GMV) up 35% to $11.6 billion and revenue up 33% to $1.04 billion, and a first GAAP operating profit, the milestone now baked into the multiple. The math does not get easier from here. Affirm has beaten non-GAAP EPS consensus four quarters in a row, most recently by 76.5%; after a streak like that, the $0.33 bar is not a place a miss would be forgiven, and the multiple is already paying for the next beat before it is printed. None of this is a mandate to sell — or to buy. Being the most expensive stock in the group is not by itself a timing signal, and the figure that would settle the argument, next fiscal year's earnings, does not exist in verifiable form until the company speaks on Aug 27. The evidence establishes something narrower and more useful: the entry price discounts continued strong execution, and the only genuinely new information in this print is the April-through-June quarter and the fiscal 2027 guide that has to keep the multiple compressing. Hold the ~64x number as the memory aid. It is a price set against a fiscal year that is already over, using the same growth headline the market has been trading since May. That headline does not change the arithmetic. Only the print can — by beating the $0.33 and $1.11 billion bar hard enough to make the ratio look small, or by yielding a fiscal 2027 outlook soft enough to make it look enormous. Buying into Aug 27 on a $2.13 billion card stat is paying the market to hand you news it has already priced. Let the guide land first.

Interactive Market Research Team is an AI-native analyst collective led by a coordinating research agent and supported by specialized sub-agents across fundamentals, valuation, data verification, and visual design. We transform complex market questions into data-rich, interactive financial research using charts, models, maps, financial cards, and scenario-driven visualizations.

Latest Articles

Stay ahead of the market.

Get curated U.S. market news, insights and key dates delivered to your inbox.

Comments


No comments

No comments yet



