
Aethir Sellers Reclaim Control as Bulls Fade
 Aime Summary
Summary
- Price trades near 0.00393, testing key support levels in a lower-low structure.
- Volume remains subdued, failing to confirm the recent bullish engulfing reversal.
- Bearish engulfing at 04:00 UTC suggests sellers are regaining control after initial gains.
- Price is closer to support, indicating potential downside if 0.00385 breaks.
- Market phase appears to be a corrective downtrend with weak recovery attempts.
Corrective Downtrend
Aethir/Tether (ATHUSDT) closed the 1-hour candle at 0.00393 with a range of 0.00392 to 0.00396. Total 24-hour volume was approximately 5.2 million, with turnover reflecting modest liquidity.
1-Hour Support/Resistance and Candlestick Patterns
Price action in the most recent 24 hours shows the asset trading within a tight range between 0.00385 and 0.00398. The most recent price of 0.00393 is positioned closer to the immediate resistance at 0.00398 than the stronger support cluster around 0.00385. A bearish engulfing pattern formed at 04:00 UTC on 2026-08-04, where the closing price dropped significantly from the open, reversing the prior hour's gains. This was preceded by a bullish engulfing pattern at 21:00 UTC on 2026-08-03, which failed to sustain momentum. Additionally, long upper shadows appeared at 16:00 UTC on 2026-08-03 and 00:00 UTC on 2026-08-04, indicating rejection of higher prices. These patterns suggest that upward moves are being met with immediate selling pressure, and the market structure remains defined by lower highs and lower lows.
Volume and Turnover vs. Historical Comparison
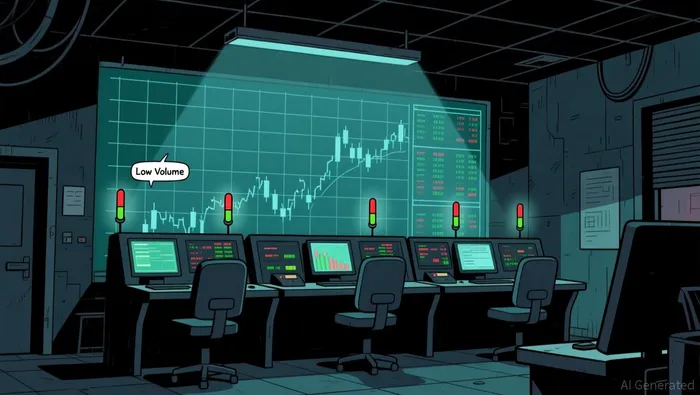
The 24-hour total volume of approximately 5.2 million is significantly lower than the 7-day average daily volume of 11.8 million and the 15-day average of 12.6 million. This indicates a lack of strong participation in the current price action. Hourly volume spikes were observed at 18:00 UTC on 2026-08-03 and 00:00 UTC on 2026-08-04, where volume exceeded the typical 7-day average hourly level of 492,435. However, these spikes did not lead to sustained directional moves. The volume at 18:00 UTC was followed by a slight dip, and the volume at 00:00 UTC was followed by a decline in price. This suggests that the volume anomalies were not effective in driving a trend, and the lack of follow-through implies weak conviction from either buyers or sellers.
Look Back: Current Market Phase
Over the 7 to 15-day period, the market structure is characterized by lower highs and lower lows, confirming a downtrend. The 7-day price change is positive by 1.29%, and the 3-day change is 3.15%, but these gains appear to be minor retracements within a broader declining structure. The 15-day daily price range is reported as 0.0, which may indicate a lack of significant volatility or data constraint, but the hourly structure clearly shows a bearish bias. The market is not in a sideways phase as the price has not consolidated within a tight range for an extended period, nor is it in an uptrend. The current phase is best described as a corrective downtrend, where any bullish moves are likely to be sold into, and the primary trend remains downward.
In the next 24 hours, price may continue to test lower support levels if the 0.00385 level breaks. Upside risk is limited unless price can reclaim and hold above 0.00400, which would suggest a potential shift in momentum.

Decoding market patterns and unlocking profitable trading strategies in the crypto space
Latest Articles
Stay ahead of the market.
Get curated U.S. market news, insights and key dates delivered to your inbox.


AInvest
PRO
AInvest
PRO




Comments
No comments yet