
Aeromexico’s Record Revenue Masks a Bearish Stock Dip
 Aime Summary
Grupo AeromexicoAERO-- (AERO) experienced a marginal decline of 0.27% over the last 24 hours, settling at $0.4023 as of August 2, 2026. This immediate dip contributes to a broader downward trajectory, with the asset recording an 8.74% loss over the past week, a 3.44% decrease over the last month, and a 0.37% contraction over the past year. The current market sentiment reflects a complex interplay between reported financial performance, strategic operational improvements, and prevailing technical indicators that suggest ongoing pressure on the stock price.
Financial Performance and Operational Efficiency
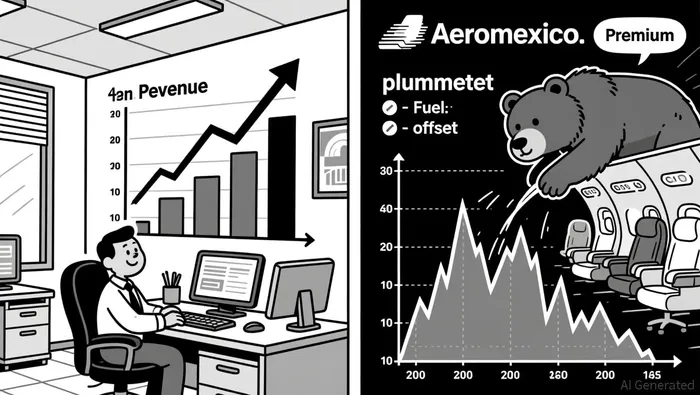
The airline’s most recent quarterly report for the second quarter of 2026 highlighted a divergence between top-line growth and bottom-line results. Revenue increased by 30% year-over-year to reach MXN 1.5 billion. However, the company reported a negative earnings per share (EPS) of -$0.40 for the period. Despite this negative earnings figure, the stock initially reacted positively, gaining 3.46% to $15.83 at the time of the report, indicating that investors may have prioritized the revenue expansion and cost management efforts over the immediate EPS miss.
A key driver of investor confidence appears to be the company’s success in mitigating fuel cost pressures. Aeromexico offset 76% of its fuel cost increases, significantly surpassing its internal target of 50%. Furthermore, the carrier achieved a record high in premium revenue mix, which accounted for 43% of total revenue, representing a 17-point increase from 2019 levels. This shift toward higher-margin premium services suggests a successful strategic pivot in customer segmentation and pricing power.
Liquidity and Forward-Looking Guidance
Financial stability remains a focal point for the company. Despite maintaining a current ratio of 0.65, which is below the ideal benchmark, Aeromexico ended the quarter with MXN 1.2 billion in liquidity. This cash position provides a buffer against short-term volatility. Looking ahead, the company provided specific guidance for the third quarter, projecting revenues between MXN 1.59 billion and MXN 1.62 billion, with mid-teens operating margins. For the fourth quarter, revenue growth is expected to range from 14.5% to 16.5% year-over-year, accompanied by operating margins between 15.5% and 18.5%.
For the full year 2026, management outlined a comprehensive outlook that includes 2-3% available seat mile (ASM) growth, 13-14% revenue growth, and operating margins of 11-13%. Additionally, the company aims to generate MXN 100 million in free cash flow. Analysts project that if fuel costs remain stable, operating cash flow for 2027 could grow by more than 30%. These projections underscore a belief in the sustainability of the current operational efficiencies and revenue mix improvements.
Analyst Sentiment and Technical Indicators
Wall Street consensus remains largely bullish, although recent coverage has introduced a more cautious perspective. Major institutions such as JPMorgan, Goldman Sachs, Barclays, and Deutsche Bank maintain "Buy" ratings with price targets ranging from $25 to $36. However, Jefferies recently initiated coverage with a "Hold" rating and a price target of $20, signaling a more neutral stance on near-term valuation.
Technically, the stock faces headwinds. As of August 1, 2026, the price stood at $15.40, with technical indicators predominantly signaling a sell position. The Moving Average Convergence Divergence (MACD) histogram turned negative, and the stock has moved below its 50-day moving average, a shift often interpreted as a transition from an upward to a downward trend. The Relative Strength Index (RSI) sits at 43.65, indicating the stock is neither oversold nor overbought but leaning toward bearish momentum. While the Stochastic Oscillator suggests a potential reversal from oversold territory, the broader technical picture, including the bearish crossover of the 10-day moving average below the 50-day average, points to continued resistance. This technical weakness contrasts with the fundamental improvements reported in the latest earnings, creating a divergence between the company's operational progress and market pricing dynamics.

Delivering real-time analysis and insights on unexpected cryptocurrency price movements to keep traders ahead of the curve.
Latest Articles
Stay ahead of the market.
Get curated U.S. market news, insights and key dates delivered to your inbox.


AInvest
PRO
AInvest
PRO




Comments
No comments yet