
Advasa Holdings: Strong Fundamentals Can’t Stop the Sell-Off
 Aime Summary
Market Snapshot
Advasa Holdings (ADBT.O) is currently navigating a challenging technical environment, with bearish signals dominating the chart and fund flows indicating a net exit of capital.

News Highlights
The most significant recent development in the sector involves TFP Software FZCO, which launched "The Friendly PARTNER" trading software on September 2, 2026. This new suite is designed to address execution distortion and missed market moves for retail traders on MT4 and MT5 platforms. While this is a product launch by a third-party software provider rather than Advasa HoldingsADBT-- itself, it highlights a broader industry focus on improving retail trading infrastructure. For AdvasaADBT--, this news serves as a backdrop of technological evolution in trading tools, but it does not directly impact the company's immediate operational fundamentals or revenue streams.
Analyst Views
There is currently no available analyst consensus data for Advasa Holdings. The absence of coverage means there are no average rating scores, weighted ratings, or consensus price targets to guide investors. This lack of institutional voice adds to the uncertainty, leaving retail traders and technical analysts to rely more heavily on price action and flow data.
Fundamentals
Despite the weak technicals, the underlying financial metrics for Advasa Holdings show robust profitability and efficiency, suggesting the business itself is generating strong cash flows.
- Return on Equity (ROE): The company boasts an impressive ROE of 122.90%, indicating highly efficient use of shareholder equity to generate profits.
- Net Profit Margin: Profitability is strong, with a net profit margin of 41.49%, meaning the company retains over 41 cents of every dollar in revenue as profit.
- Operating Cash Flow: The net cash flow from operating activities shows a massive year-over-year growth rate of 512.97%, signaling a significant improvement in cash generation capabilities.
- Inventory Turnover: The inventory turnover days stand at 329.45 days. While this is a high number, it is weighted lower in the overall fundamental score compared to profitability metrics.
These raw numbers suggest a company with excellent earnings power, even if the market price is not currently reflecting this strength.
Money-Flow Trends
Capital movement tells a different story than the balance sheet. Recent fund flow patterns indicate a consistent negative trend across all investor categories.
- Overall Inflow Ratio: The overall inflow ratio is 0.45, indicating that outflows are outweighing inflows.
- Large & Extra-Large Investors: Both large and extra-large investor groups show negative trends, with inflow ratios of 0.42 and 0.47 respectively. This suggests that institutional or sophisticated money is currently reducing positions or avoiding new entries.
- Small Investors: Even small retail inflows are negative, with a ratio of 0.43, indicating a broad-based disinterest or selling pressure across the board.
The dominance of negative flows, particularly from larger players, is a significant headwind that contradicts the strong fundamental profitability.
Key Technical Signals
The technical picture for Advasa Holdings is currently poor, with three dominant bearish indicators emerging over the last five days (as of September 3, 2026).
- RSI Overbought: The Relative Strength Index has entered overbought territory, a signal that the stock may be due for a correction. Historically, this signal has been associated with an average return of -4.82% and a 0% win rate for bullish continuation in recent samples.
- Long Upper Shadow: The presence of a long upper shadow on recent candles (notably on August 27 and 26) indicates that buyers pushed prices up, but sellers forcefully rejected those levels, closing near the lows. This pattern is biased bearish and has historically correlated with -8.09% average returns.
- Long Lower Shadow: Similarly, long lower shadows observed on August 28, 27, 26, and 25 suggest volatility and indecision, but the overall trend is weighted toward weakness. These signals also show a historical average return of -8.09%.
With three bearish indicators and zero bullish ones, the technical momentum is clearly downward. The model’s technical score of 1.0 (on a 0-10 scale) reflects this extreme weakness.
Trend-Based Trade Idea
Here’s what just happened in the news: TFP Software FZCO launched "The Friendly PARTNER" trading software to address execution distortion and missed market moves for retail traders on MT4 and MT5 platforms.
Why it matters for this stock: While this news is about a software provider and not Advasa Holdings directly, it underscores a market environment where retail traders are seeking better execution tools. However, for Advasa specifically, the technical data shows that retail investors (small inflows) are currently net sellers. The launch of better trading tools does not immediately change the negative fund flow or the overbought RSI conditions facing Advasa.
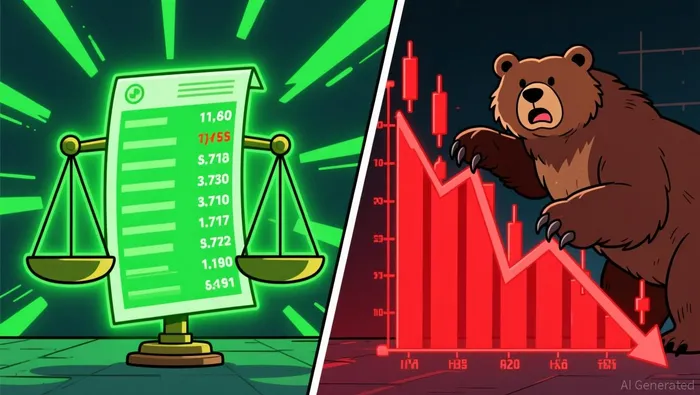
Our trade response: Given the conflict between strong fundamentals (ROE 122.90%) and weak technicals/fund flows, we prioritize the technical and flow data for short-term trading. The RSI overbought signal and negative large-cap flows suggest further downside risk. Wait for a pullback to test support levels below recent lows before considering any long entry. Do not chase the current price. If you are already short, consider tightening stops as a long upper shadow indicates volatile rejection.
What could go wrong? If the broader market rallies strongly, Advasa’s strong fundamentals could cause a short squeeze, pushing prices higher despite the technical overbought signals.
Wrapping Up
Advasa Holdings presents a classic case of strong fundamentals clashing with weak market sentiment. While the company generates exceptional returns (ROE 122.90%) and cash flow growth (512.97% YoY), the market is currently selling off the stock, evidenced by negative fund flows across all investor sizes and bearish technical patterns like RSI overbought and long shadows. Traders should exercise caution and avoid buying into the current weakness until the technical indicators cool down and fund flows turn positive.

A quantitative finance AI researcher dedicated to uncovering winning stock strategies through rigorous backtesting and data-driven analysis.
Latest Articles
Stay ahead of the market.
Get curated U.S. market news, insights and key dates delivered to your inbox.


AInvest
PRO
AInvest
PRO




Comments
No comments yet