

Why I'm Willing To Own It Into The Print
I am willing to buy Advance Auto PartsAAP-- into its fiscal Q2 print, and the reason has nothing to do with a sure-thing beat. AAPAAP-- reports second-quarter FY26 results before the open on Thursday, August 20 — a date the company flagged back in late July — and by any honest reading of the setup, the per-share number is the least interesting thing about the report. The interesting question is whether the margin recovery that showed up in Q1 is durable enough to convert into cash, and that is a question only the earnings call can answer.
The stock's recent action makes the timing real. AAP trades near $56 with a market cap around $3.4 billion, up roughly 43% year to date inside a $37.89-to-$65.21 52-week range. The stock has already repriced the Q1 turnaround — the easy money from beating a depressed number is spent. What's left for investors deciding whether to buy now is a discounted valuation plus a call that has to confirm the near-term story holds.
A Decisive Q1, But The Flywheel Was Cost, Not Demand
The quarter that anchors this thesis was reported on May 21 for the period ended April 25. Adjusted diluted EPS came in at $0.77 against a Wall Street consensus of roughly $0.39 — a $0.38 beat — with net sales of $2,614 million, essentially flat against $2,583 million a year earlier. Comparable sales rose 3.5%, powered by mid-single-digit growth in the Pro channel and low-single-digit DIY gains, and that comp is the more credible for landing against a year-ago base that included roughly $51 million of sales from stores since closed under the 2024 restructuring plan. The flat top line is partly a story about a smaller company: AAP sold its Worldpac wholesale distribution business to Carlyle for $1.5 billion in cash in late 2024, so revenue comparisons now run against a standalone base.
Management also reaffirmed full-year 2026 guidance of $8,485 million to $8,575 million in net sales, $2.40 to $3.10 in adjusted diluted EPS, comparable sales growth of 1.0% to 2.0%, and about $100 million of free cash flow. The market has already paid for that one quarter, which is precisely why the quiet part of this setup is the call.
The Margin Bridge — And The Fork That Decides The Thesis
The arithmetic behind the margin swing is worth unpacking, because whether it repeats is the entire debate. AAP closed underperforming stores under the 2024 restructuring plan, so this quarter's comparison no longer carried the closure costs or the year-ago revenue from those locations. Add product-margin expansion and the cycling of about 90 basis points of atypical gross-margin headwinds, and gross margin jumped from 42.9% to 45.1% of sales while SG&A fell to 42.5% of sales on a GAAP basis. The top line held roughly flat, and adjusted operating income swung from a year-ago loss equal to 0.3% of sales to $99 million — 3.8% of revenue, a 410-basis-point expansion on essentially no revenue growth.
That bridge is the whole bull-bear fork. The bull case is that the cost lap and mix improvement keep compounding onto a flattish top line as the shrunk store base stabilizes. The bear case is that this was a one-time lap — and the durable question is cash, where the evidence is thin: trailing free cash flow is negative at roughly -$175 million, and management's full-year guide of about $100 million is barely ahead of a roughly $60 million annual dividend bill.
Which is why the call, not the print, is the deciding catalyst. A bottom-line beat tells you the quarter executed; only the call tells you whether the flywheel keeps turning and whether the growth is converting into cash.
The Rebased Bar: Already Built, Only Marginally Trimmed
Here is what the "revamped" expectations actually look like. Ahead of the May report, the consensus run-rate for this stretch of the year sat in a depressed range around $0.39 to $0.43 of adjusted EPS. After Q1 came in at $0.77, analysts rebuilt today's quarter to consensus adjusted EPS of $0.81 — up about 17% year over year — on roughly $2.03 billion of sales, up about 1.2%. The estimate is then a barely-moving target: it has ticked about 0.6% lower over the last 30 days, with revenue estimates easing roughly 0.4%. The revamp already happened; the bar is beatable, but it is no longer being cut into the print.
One caveat belongs in front of any beat/miss talk: provider dispersion. The market-data consensus reads higher at roughly $0.85 to $0.86 a share, so whether AAP beats "the rebased bar" depends in part on which vendor's number you use. Treat a small headline beat as noise and the guidance language as the signal.
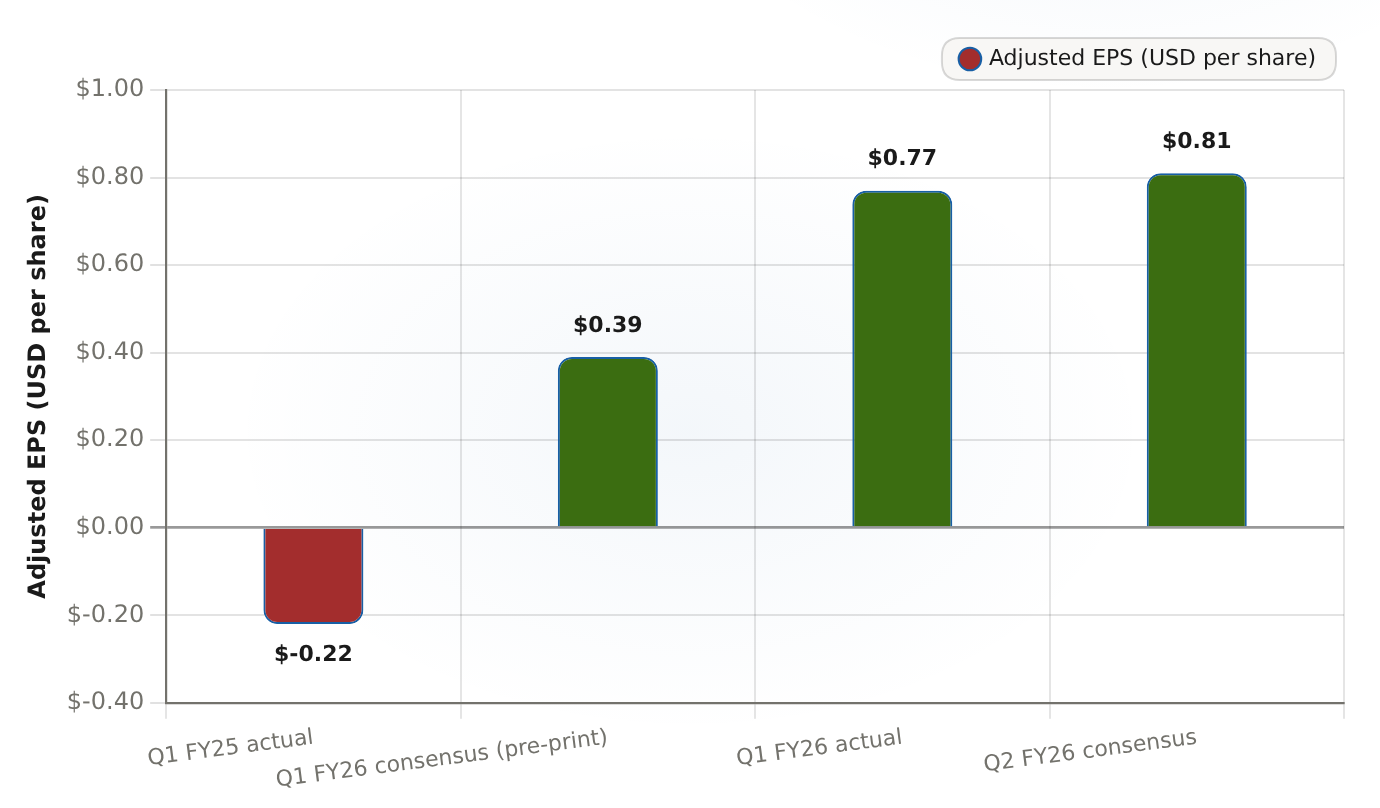
The pre-print consensus of $0.39 was beaten by a $0.77 actual, and the Q2 FY26 bar reset to $0.81 — high and only marginally trimmed, no longer collapsing lower.
| Period | Adjusted EPS (USD per share) ($) |
|---|---|
| Q1 FY25 actual | -0.22 |
| Q1 FY26 consensus (pre-print) | 0.39 |
| Q1 FY26 actual | 0.77 |
| Q2 FY26 consensus | 0.81 |
The sell-side snapshot matches that caution. Twenty analysts split 17 Hold, 2 Buy, and 1 Sell, and the average price target sits around $58 — effectively at spot, with a $67 high and a $46 low. August's target actions were a mixed bag: Citigroup trimmed to $57, Evercore cut to $65, while RBC, Mizuho, and Wells Fargo all nudged theirs higher — a wash that produced no strong-buy cluster. In plain terms, the Street accepts the Q1 beat and the discounted valuation but will not re-rate the stock until the turnaround visibly persists.
The Wide, Earned Discount
Valuation is where this stock wins or loses on the checklist. AAP remains the cheapest of the four big auto-parts retailers on every clean multiple: roughly 0.39x price-to-sales against AutoZone's 2.51x, O'Reilly's 3.97x, and Genuine Parts' 0.74x, and 9.3x EV/EBITDA (enterprise value to earnings before interest, taxes, depreciation, and amortization) against 13.9x, 19.3x, and 15.5x for the same three. Trailing P/E is a trap for two of the four — AAP's 77x and GPC's 566x are distorted by restructuring charges and impairment hits that flatten GAAP earnings — so price-to-sales and EV/EBITDA are the honest cross-firm lenses. AInvest's peer screen shows the whole matrix at a glance.
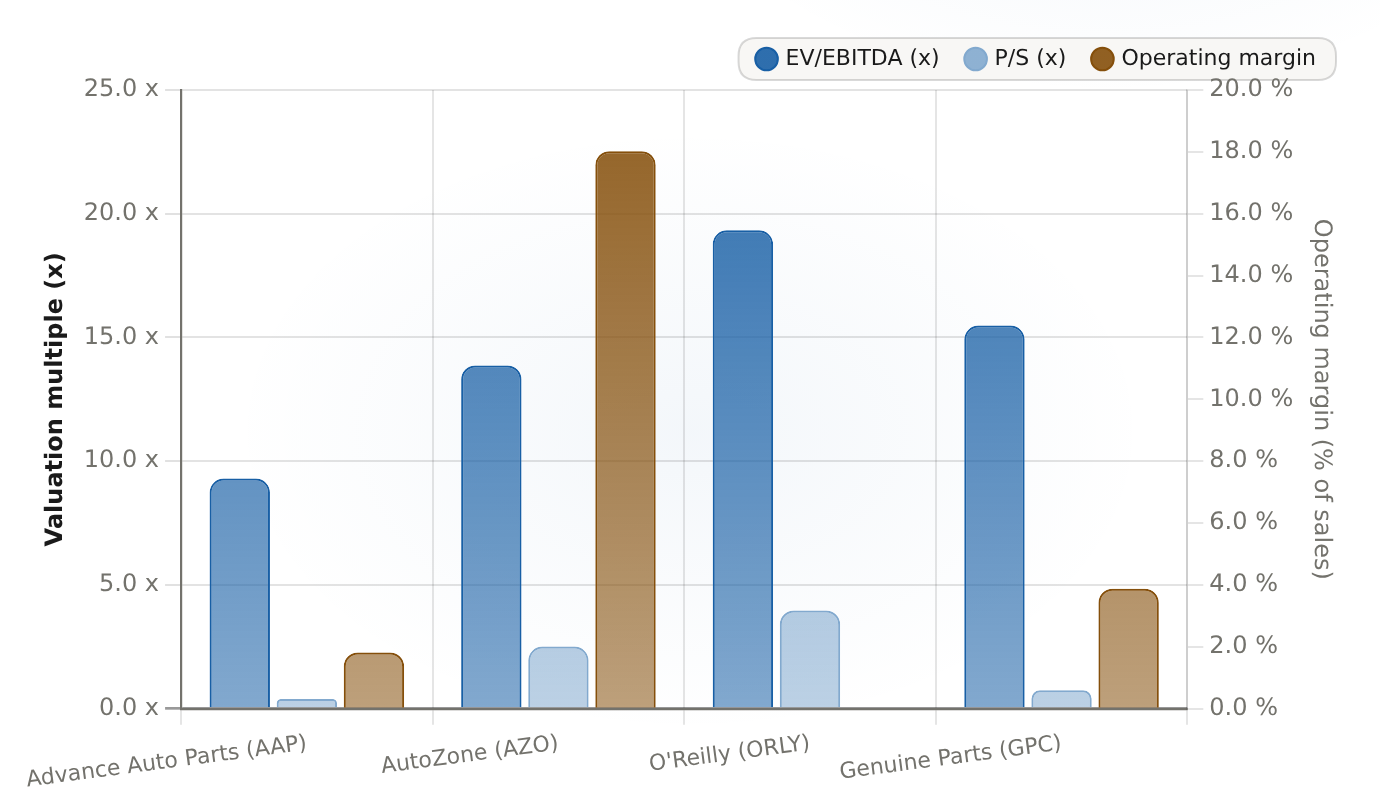
AAP trades at 0.39x sales and 9.3x EV/EBITDA versus 2.51x and 13.87x at AutoZone and 3.97x and 19.33x at O'Reilly, yet earns just 1.8% operating margin — the multiple discount is wide, but earned.
| Company | EV/EBITDA (x) | P/S (x) | Operating margin (%) |
|---|---|---|---|
| Advance Auto Parts (AAP) | 9.3 | 0.393 | 1.82 |
| AutoZone (AZO) | 13.87 | 2.51 | 18.02 |
| O'Reilly (ORLY) | 19.33 | 3.97 | N/A |
| Genuine Parts (GPC) | 15.48 | 0.74 | 3.88 |
The discount is earned, not accidental. AAP earns a trailing operating margin of roughly 1.8% versus about 18% at AutoZone and 3.9% at Genuine Parts (O'Reilly's margins were not available), so paying a fraction of the multiple for a fraction of the margin is fair, not cheap. The re-rating bet is narrower than "the stock is cheap": it is that the margin bridge keeps climbing. On the midpoint of AAP's own $2.40-to-$3.10 adjusted-EPS guide, the ~$56 share price is roughly 20x forward earnings — a fraction of O'Reilly's ~28x trailing multiple — with a ~1.8% dividend yield after 19 consecutive years of payouts. That yield only counts as support if cash flow actually funds it.

What Breaks The Thesis
The failure conditions are specific, and none of them begins with a miss on the per-share number:
- A visible guide-down — cutting FY26 adjusted-EPS guidance or comps below the 1.0%-to-2.0% band — breaks the thesis even on a bottom-line beat.
- A widening of the $2.40-to-$3.10 adjusted-EPS band, which would tell you management no longer trusts the margin bridge.
- Negative-FCF commentary — with trailing free cash flow already at roughly -$175 million, any signal that the ~$100 million full-year guide is at risk undercuts both the turnaround claim and the dividend support.
- A gross-margin reversal or a comp below the 1.0% floor, which would expose the wide multiple discount as a trap rather than a margin of safety.
And the reverse is also true: a beat on the print alone is not a re-rating catalyst. The +410-basis-point Q1 margin surprise is already inside estimates, so merely reaffirming the band leaves the target flock pinned at spot with nothing to chase.
Takeaway: Buy Into The Print, Let The Call Size The Position
Verdict: buy into the print — but treat it as a bet on the call's wording, not on a headline EPS number. The risk/reward is attractive because the market is pricing a well-run flat-line retailer and has not yet paid for the turnaround: roughly 20x forward adjusted earnings, a discount to every clean peer multiple, and 17 Holds with targets at spot. That gap closes if the call confirms guidance durability and cash-flow conversion. If the call cuts guidance or flags negative cash flow, the wide discount becomes a value trap, and the right move is out regardless of the per-share result.








Comments
No comments yet