

The consensus number going into Nvidia's August 26 report sits barely above what management already promised. Street estimates for the July quarter — $91.85 billion in revenue, $2.08 in EPS — sit only about 0.9% above the company's own $91 billion ±2% guide, a guide built with all China data-center compute excluded. A bar that close to guidance makes the print itself a low-information event: the market has already priced, guided, and re-priced the range. The informative move already happened, on August 21, when Benchmark Company's Cody Acree lifted his fiscal-second-quarter revenue estimate to about $92 billion with EPS to $2.10, raised his fiscal-Q3 numbers, and kept a Buy rating with a $335 price target through the print. My stance into this report is hold and accumulate, not sell. And the number that decides the case is not next Wednesday's print. It is the guide NvidiaNVDA-- issues for its October quarter.
A bar this low is a guidance story, not a beat story
The August 12 street consensus puts fiscal Q2 revenue at $91.85 billion, up about 96.5% year over year, with EPS at $2.08. Compare that with the company's own $91 billion ±2% guide, set three months ago and built with China's data-center compute entirely excluded — consensus is under 1% above it. That consensus is itself a moving target: it climbed from roughly $86.4 billion on revenue and $1.76 on EPS as of May 20 to $91.85 billion and $2.08 by August 12, a roughly $5 billion lift through the window that the street has already absorbed. The compression works from both directions — Nvidia has beaten its own guidance midpoint for 13 straight quarters, but the beat margin has narrowed from +22.8% back in Q2 of fiscal 2024 to roughly +4.6% in fiscal Q1 FY27. When the gap between guidance and the street collapses this far, expectations have already done the heavy lifting before the quarter is even reported, and a beat at this bar tells the market almost nothing it doesn't already know.
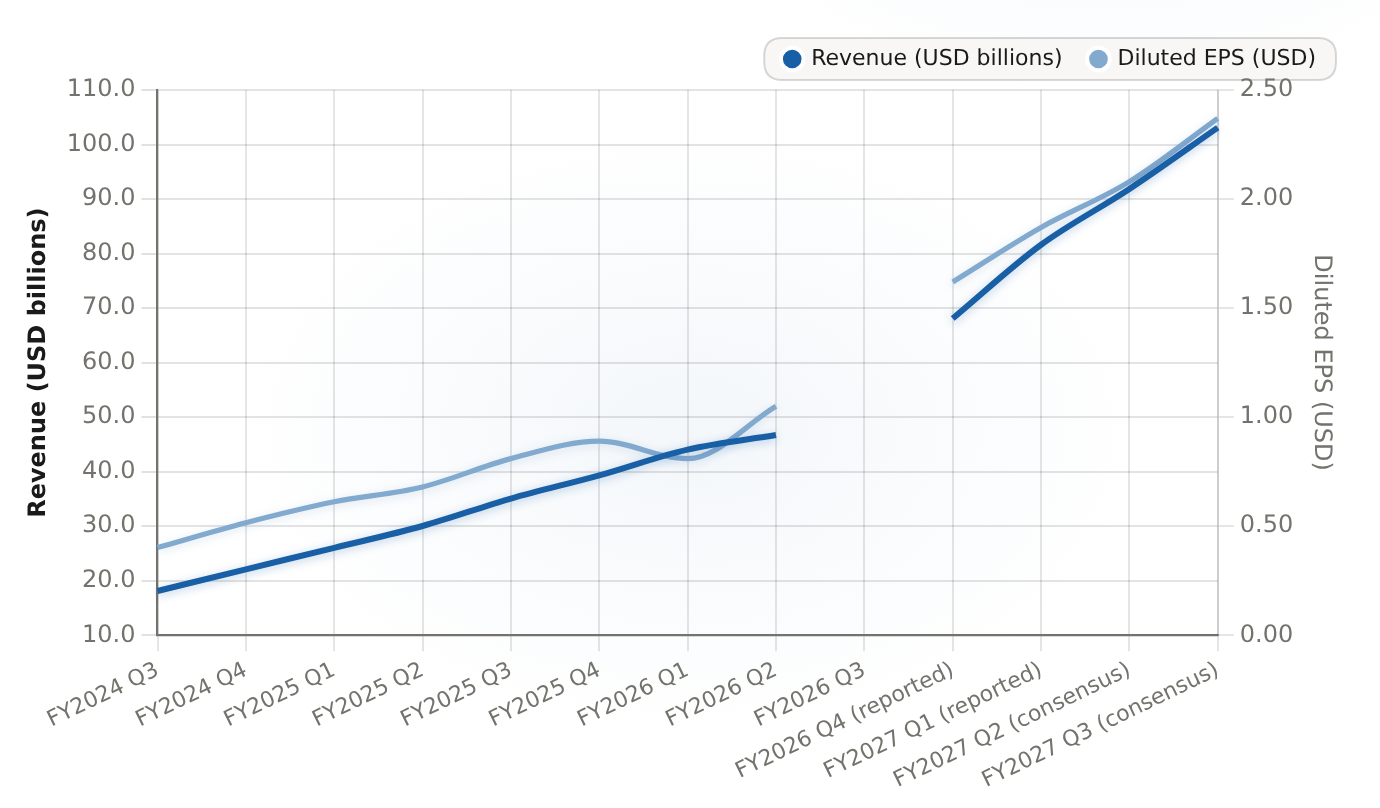
Revenue compounded from $18.1B to a $103.1B / $2.37 consensus for Q3 FY27, the October-guide test quarter, while the Q2 FY27 print sits only ~0.9% above the company's own guide, a deliberately low-information bar.
| Period | Revenue (USD billions) | Diluted EPS (USD) |
|---|---|---|
| FY2024 Q3 | 18.12 | 0.402 |
| FY2024 Q4 | 22.1 | 0.516 |
| FY2025 Q1 | 26.04 | 0.612 |
| FY2025 Q2 | 30.04 | 0.68 |
| FY2025 Q3 | 35.08 | 0.81 |
| FY2025 Q4 | 39.33 | 0.89 |
| FY2026 Q1 | 44.06 | 0.81 |
| FY2026 Q2 | 46.74 | 1.05 |
| FY2026 Q3 | N/A | N/A |
| FY2026 Q4 (reported) | 68.1 | 1.62 |
| FY2027 Q1 (reported) | 81.62 | 1.87 |
| FY2027 Q2 (consensus) | 91.85 | 2.08 |
| FY2027 Q3 (consensus) | 103.1 | 2.37 |
The quarterly series puts all of this on one trendline. Revenue has run from $18.1 billion in Q3 of fiscal 2024 to $81.62 billion reported in Q1 FY27, with the consensus path through $91.85 billion for the July quarter and $103.1 billion for the October quarter drawn straight on the curve. Two details carry the analysis. First, the July-quarter consensus is only a modest sequential step off a $81.62 billion quarter — the bar really is as low as it looks, which is why beating it will not move the stock by itself. Second, the October quarter is the first number on that trendline that has not been effectively pre-written by guidance; it is the column that turns the chart from a history of beats into a test of acceleration.
The estimate lift is the demand signal the print cannot give you
On August 21, four trading sessions before the report, Cody Acree of Benchmark Company — the top analyst on the stock at that firm — pressed his July-quarter revenue estimate to about $92 billion with EPS to $2.10, and lifted fiscal-Q3 revenue to $103.957 billion, up from $101.747 billion, with EPS to $2.37, up from $2.31. He stayed Buy-rated and kept a $335 price target — a target he had first raised from $250 back on May 21, the day after the Q1 report. The stated rationale breaks into five claims: positive company commentary through the quarter; accelerating AI capex from Nvidia's hyperscaler customers; a deliberately conservative early read on China contribution; the market's focus shifting past the July-quarter variance to the October guide; and the first Vera Rubin system standups plus the gross-margin bridge as the next analytical milestones.
I do not trade on price targets — those are opinions, and analysts spend most of their time catching up to events that already happened. But an estimate lift ahead of a low-bar print is a different kind of evidence. Analysts raise quarterly estimates when company commentary and order flow give them a reason, and Acree's Q3 move — roughly $2.2 billion of added revenue — is a concrete bet that the October guide comes in at or above the roughly $103 billion the street is already modeling. That is a demand signal filed before the print, coming from the analyst who covers the names best positioned to see GPU order books. It carries more weight for me than the $335 target itself, which sits roughly 55% above the ~$216 stock and serves as a bracket rather than a thesis.

The capex conduit is still accelerating — that is why the lift is credible
The reason an estimate lift moves my assessment more than ordinary consensus churn is the structure underneath it: hyperscaler capex is the leading indicator for Nvidia's data-center revenue, on roughly a one-to-two-quarter lag. Q1-2026 combined capex of about $130.6 billion maps onto fiscal Q1 FY27 data-center revenue of $75.2 billion.
That conduit is still pointed firmly up. Combined Microsoft, Alphabet, Amazon and Meta capex reached $166.01 billion in Q2-2026, up 87% year over year and 27.1% sequentially — a cumulative +272% over ten quarters. Full-year 2026 guides have been revised upward repeatedly to roughly $760 billion combined, against about $410 billion deployed in 2025. As long as capex keeps accelerating, the mechanism says Nvidia keeps beating its own guide midpoint, which the 13-quarter streak already demonstrates. Put plainly: the July print is not the gate. The October guide versus roughly $103 billion of consensus is the gate — a guide below consensus would be the first downshift signal this cycle has produced, and a guide at or above it keeps the conduit intact.
The "however": second-source silicon and a China-shaped hole
Every robust demand picture deserves a stress test, and this one has two live risks — and both are structural, not cyclical. The first is second sourcing. Meta has committed to a custom AMD Instinct MI450 deal reported at roughly $100 billion and up to 6GW, an inference-optimized chip built on TSMC 2nm with up to 432GB of HBM4, and Google's TPU, Amazon's Trainium and Microsoft's Maia keep pulling more inference workloads toward custom silicon. Training workloads stay locked on CUDA — on the order of 80% of AI accelerator revenue by one estimate — but the fastest-growing inference workloads are contestable on cost-per-token and power-per-token. My read is the share-versus-TAM framework: Nvidia does not need a 90%+ share to keep compounding if the market itself is expanding this quickly. A lower share inside a rapidly growing pool still means rising absolute revenue.
The China risk is sharper because it gates the total addressable market directly. Export controls historically removed at least roughly 20% of Nvidia's data-center revenue, and yet as of early 2026 the company had generated zero revenue from US-approved China chips — and Q2 FY27 guidance excludes all China data-center compute. That creates a clean asymmetry. If approvals resume and the October guide begins to re-add China, that is a free upside call layered on top of a China-excluded base. If the exclusion proves permanent, the addressable market stays structurally smaller and well-funded domestic Chinese players fill the gap. The language of the October guide is where this question gets answered.
The financial quality check: an elite compounder feeding the buildout
Fiscal Q1 FY27, reported May 20: revenue of $81.62 billion, up 85.2% year over year, with EPS of $1.87 — a beat against consensus of $78.42 billion and $1.76. Data center alone was $75.2 billion, roughly 92% of revenue. Full-year fiscal 2026 came in at $215.9 billion, up 65%, with data center at $193.7 billion, up 68%, and Q4 FY26 non-GAAP gross margin at 75.2%. Trailing free cash flow is about $119 billion — roughly a 47% margin — against about $72 billion of net cash, and Nvidia returned $41.1 billion to shareholders in fiscal 2026 with roughly $58.5 billion still authorized.
That quality is what makes this a hold-through-compression name rather than a trade-around-it name. The company is funding its own capacity expansion out of cash flow, rewarding holders with buybacks while scaling, and clearing margins north of 75% at this revenue base. Whatever short-term noise the August print produces, the balance sheet is not where this thesis breaks.
Where the valuation sits: compressed by the standards of its own peer set
Per Ainvest's peer screen, at roughly $216 and a $5.22 trillion market cap, Nvidia trades at 32.7x trailing earnings and 31.1x trailing EV/EBITDA, with price-to-sales near 20.6x and a PEG around 0.30. The comparison that matters is not against software names — it is against silicon. Broadcom sits at 59.5x trailing earnings and 43.1x EV/EBITDA; AMD at 119.8x and 79.9x; while Nvidia's 32.7x and 31.1x put it essentially in line with TSMC at 31.9x and 21.5x.
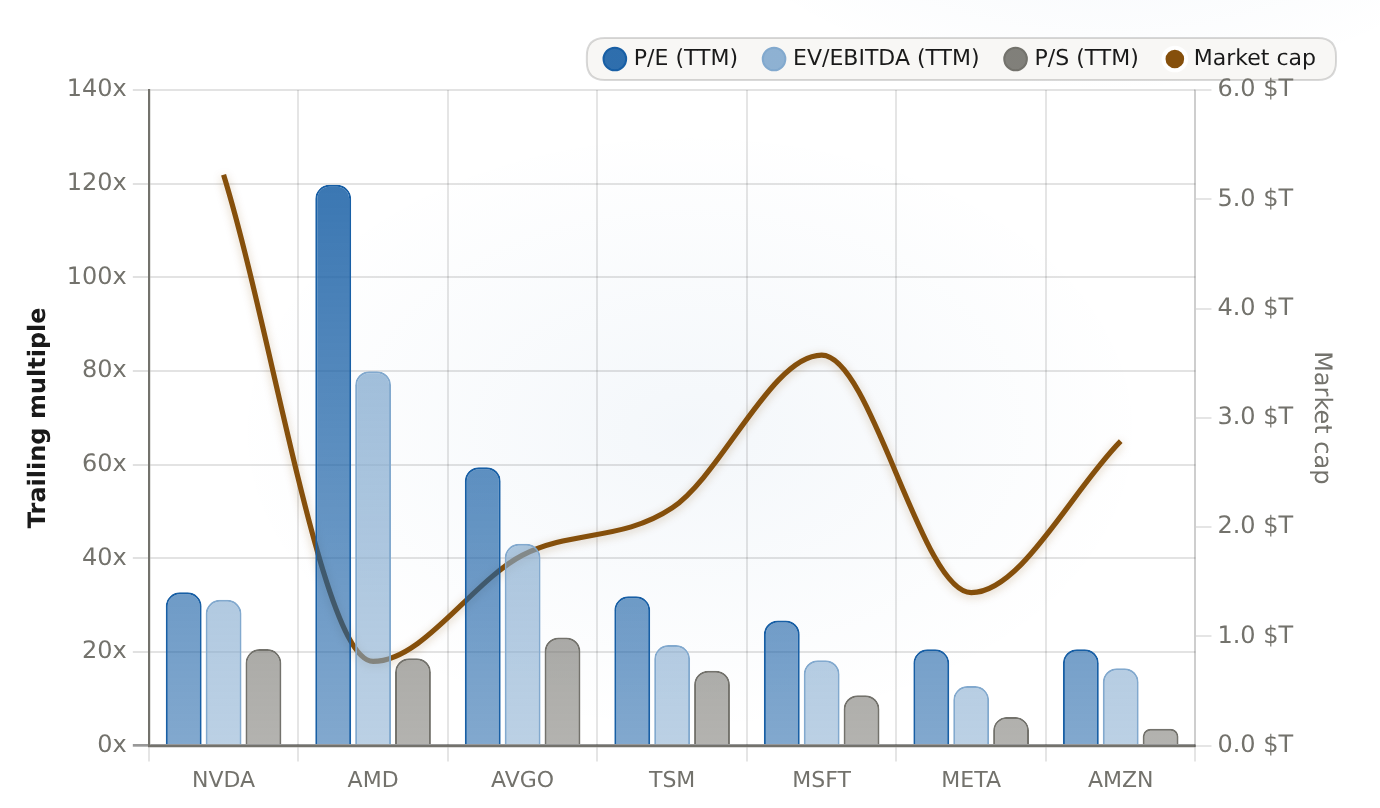
At 32.7x trailing P/E and 31.1x EV/EBITDA, NVDANVDA-- trades far below AVGO (59.5x / 43.1x) and AMD (119.8x / 79.9x) and close to TSM (31.9x / 21.5x) — a $5.22T market cap with a P/E below the other chip designers (AVGO, AMD).
| Ticker | P/E (TTM) (x) | EV/EBITDA (TTM) (x) | P/S (TTM) (x) | Market cap ($T) |
|---|---|---|---|---|
| NVDA | 32.73 | 31.12 | 20.61 | 5.224 |
| AMD | 119.76 | 79.94 | 18.66 | 0.7705 |
| AVGO | 59.45 | 43.09 | 23.1 | 1.743 |
| TSM | 31.88 | 21.47 | 15.98 | 2.175 |
| MSFT | 26.72 | 18.25 | 10.77 | 3.573 |
| META | 20.56 | 12.71 | 6.13 | 1.4 |
| AMZN | 20.59 | 16.53 | 3.59 | 2.786 |
Let me translate that into an investment implication rather than leave it as a table. The company at the center of the largest compute buildout in history trades at a discount to the diversified silicon peers and at a premium of essentially nothing over the foundry that merely manufactures for everyone — including for Nvidia's competitors. That is an unusual configuration, and it is what makes accumulate-on-weakness coherent. Buyers are not paying for the peak; they are paying below the peer set for the one name whose demand is underwritten by accelerating capex. The shares are up 15.7% year to date and sit about 9% under the 52-week high of $236.54, which gives accumulation a concrete entry discipline: add into selloffs, not into prints.
The decision: accumulate into the print, with two hard tripswires
My call is explicit: hold your position and accumulate into weakness through the August 26 print, and into the October guide window that follows it. Do not sell into the report because the beat is small — the beat is small by design, because the bar is guided that way. Treat a beat-and-selloff reaction, or a drop driven by logistics noise around the Rubin transition, as a buying opportunity rather than a thesis break. Stay positioned to add on weakness, and keep the size proportionate to what this setup actually supports — a low-variance print with the real catalysts two months out.
That posture rests on two hard failure conditions, and if either shows up in the October guide, the case flips and the accumulation thesis is off. The first is a permanently China-excluded revenue base — if the October guide keeps China fully out with no sign that approvals are returning, the total addressable market is structurally smaller and Chinese rivals absorb what Nvidia cannot sell, breaking the TAM assumption underneath the thesis. The second is a gross-margin bridge that breaks below roughly 74% as Vera Rubin ramps, or Vera Rubin standup delays that push October-quarter revenue below the ~$103 billion consensus — either one says the architecture transition is costing more than the demand is worth. The earlier-warning signal, one quarter ahead of those tripswires, is the October guide itself: a guide below roughly $103 billion is the first downshift from this capex conduit.
The closing calculation
The debate is not whether Nvidia remains the center of the AI infrastructure buildout — it is whether the return profile still beats the alternatives at this entry. At about 33x trailing earnings with a PEG near 0.3, growth still compounding above 80%, hyperscaler capex still accelerating, and the top analyst at a benchmark firm raising estimates five days before the print, I believe the asymmetry favors holding and accumulating into and through the October guide. My time horizon is the one the setup demands: the near-term window ends where the guide lands, and the decade-scale thesis — Nvidia as the compounding center of accelerated computing — is unchanged by anything a low-bar quarter can print. If the China exclusion turns permanent or the margin bridge breaks, capital comes out and the debate reopens. Until then, the estimate lift is the signal, and October is the test.








Comments
No comments yet