
S&P 500's Soaring Heights: A Golden Opportunity or a Precarious Peak?
The S&P 500 has surged to record highs in early 2025, fueled by robust earnings, a Fed on hold, and a resilient labor market. Yet beneath the surface, technical indicators flash warnings of overbought conditions, while macroeconomic risks loom large. Is this rally built to last, or is it a bubble inflated by fleeting optimism? Let's dissect the data.
The Rally's Pillars: Fed Policy and Earnings Momentum
The Federal Reserve's decision to keep the federal funds rate at 4.25%-4.50% for the fourth consecutive meeting has provided a stability anchor. With inflation projected to decline to 2.1% by 2027 and unemployment holding steady at 4.5%, the Fed's cautious stance has allowed equities to rally.
Earnings have also been a tailwind. Despite IT sector struggles—driven by declines in Nvidia and Apple—91% of S&P 500 companies beat Q1 estimates. Communication Services and Financials led the charge, with 95% and 91% of firms in these sectors exceeding expectations. This dispersion has reshaped the market: the S&P 500 Equal Weight Index rose 3% YTD as of February 2025, outperforming the cap-weighted benchmark.
But not all sectors are thriving. Energy stocks, battered by geopolitical oil price swings, lagged sharply. Meanwhile, the Magnificent 7 (the largest S&P 500 stocks) now account for just 28% of the index's gains—a shift toward broader participation.
Technical Indicators: Overbought or Oversold?
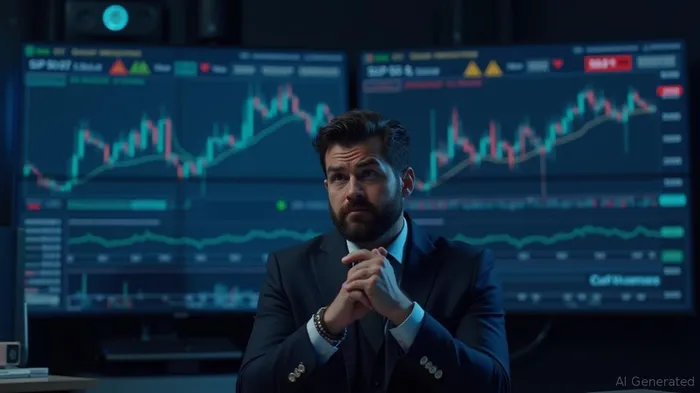
While the S&P 500 hit 6,150 in mid-June, technicals suggest caution.
- RSI (14-Day): Dipped to 45 in June from an overbought 65 in late May, signaling a loss of upward momentum.
- Moving Averages: The 50-day SMA has acted as resistance since April, and a close below the 200-day SMA (~4,550) would confirm a bearish trend.
- Volatility: The VIX dropped from a 52 peak in April (highest since 2020) to 30 by June, but remains elevated.

The 38.2% Fibonacci retracement at 4,520 and the 50% level at 4,200 are critical support zones. A breakdown below 4,500 could trigger a sharp selloff, driven by technical selling and macro risks like U.S.-China tariff disputes.
Valuation: The Shiller CAPE's Warning
The S&P 500 Shiller CAPE Ratio—which smooths earnings over 10 years—hit 35.23 in June 2025, up from 35.77 in September 2024. Historically, readings above 30 have signaled overvaluation, with higher ratios linked to lower future returns. At this level, the market's forward return expectation is just 2.4%, per historical patterns.
While earnings growth has justified some valuation expansion, the CAPE's proximity to its 2007 peak (44.2) raises red flags. If inflation stubbornly stays above 2%, or recession fears materialize, this multiple could compress sharply.
Sector Rotations and Defensive Plays
The market's dispersion highlights opportunities—and risks.
- Winners: Communication Services (up 4% in late 2024) and Financials have led, driven by rate-sensitive banks and cloud-software growth.
- Losers: IT remains the only sector in the red, with Apple and Nvidia struggling against weak AI chip demand.
- Defensive Sectors: Utilities and dividend aristocrats—like NextEra Energy—offer stability. The S&P 500 Dividend Aristocrats Index has outperformed the broader market by 200 basis points since 2023.
Volatility and Sentiment: The Elephant in the Room
The Cboe S&P 500 Dispersion Index (DSPX) hit a record 37 in January 2025, signaling extreme sector divergence. This dispersion reflects investor uncertainty: while some sectors thrive, others face headwinds.
- Tail Risks: China's $60 trillion in household deposits, trapped in low-yield accounts, could spark a liquidity crisis if fears of inflation or capital controls rise.
- Geopolitical Tensions: The U.S.-China tariff war and Middle East conflicts keep the VIX elevated.
Investment Strategy: Proceed with Caution
The S&P 500's rally is not a bubble—yet—but complacency is unwise. Here's how to navigate:
- Capitalize on Dips in Outperforming Sectors: Buy Communication Services and Financials on pullbacks below their 50-day SMAs. Avoid IT unless AI demand stabilizes.
- Hedge with Defensive Plays: Allocate 20-30% to utilities, REITs, or the S&P 500 Low Volatility Index (SPYV).
- Use Protective Tools: Consider SPX puts (e.g., September 2025 expirations) or tail hedge ETFs like VXTH. Maintain 30-40% cash to exploit potential corrections.
- Avoid Overvalued Momentum Stocks: The Shiller CAPE suggests caution in sectors trading at CAPE ratios above 40 (e.g., some software stocks).
Final Take
The S&P 500's surge is neither a bubble nor a guaranteed buy. While earnings and Fed policy support the rally, technical overhangs and valuation risks demand discipline. Investors should focus on quality, diversify across sectors, and stay nimble—because this market's next move hinges on resolving macro risks and sustaining dispersion.
Act now, but don't overreach. The path forward is volatile—but prepared investors can navigate it.
Stay ahead of the market.
Get curated U.S. market news, insights and key dates delivered to your inbox.

Comments
No comments yet