
The S&P 500's 'Rarest Warning Signal' Has Been Flashing for Nine Years
 Aime Summary
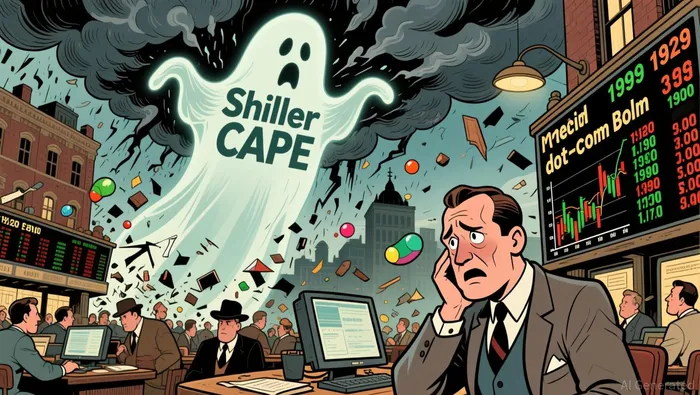
The number doing the warning is not today's price. It is the ratio of today's price to the average of the last ten years' inflation-adjusted earnings — a smoothing trick economist Robert Shiller built so one bad quarter would not rewrite the story. That ratio, CAPE, now sits just above 40. In 155 years of data it has been higher only once: 44.2, at the very top of the dot-com bubble in late 1999. Add the only other time it cleared 30 — 32.56, weeks before 1929 — and the headline writes itself: the S&P 500 is sending its rarest warning signal, the kind that has preceded two of history's great crashes.
That sentence is doing a lot of work. Follow the denominator, because that is where the arithmetic hides.
The clean retelling quotes two flashpoints and stops there. What it leaves out is how long this has been lit. CAPE crossed 30 in 2017 and has stayed above it since, dipping only briefly in 2020, 2022, and 2025 — nine straight years. Before that stretch it sat below 30 for nearly fifteen years, from 2002 to late 2017. So the "flash" is not a recently tripped alarm; it is the permanent state of the current bull market. Anyone who sold at the first crossing in 2017 sat out roughly 190% of subsequent gain.
The two earlier signals meant something different in their own era. In the decades before 1997, a reading above 30 was genuinely exotic. Today it is the baseline, and a baseline is not a warning — it is the price of admission. It is also a bull that has already paid well: the S&P 500 is up 11.5% this year.
Now test the timing claim, because that is the load-bearing part of the headline. In 1929 the ratio cleared 30 less than three months before the panic. In 1997 it cleared 30 too — then climbed for more than two years before the dot-com bust began in early 2000. Same signal, three months versus roughly three years of waiting, and the doubling of the market happened after 1997, not before. Crashes also arrive at every valuation level. One tally of bear markets since 1925 finds them starting both below and above the long-run median reading of 17.8, with valuations at turning points ranging from 18.7 to 43.5 — and the severe 1937 decline began at CAPE 22, the shallow 2022 one at 36.9. High valuation neither guaranteed nor timed the severity.
So if CAPE does not pick the top, why do serious people keep quoting it? Because it was never built to. CAPE is a long-run expected-returns gauge, not a market timer. Shiller's own research finds higher starting readings correlate with lower ten-year real returns ahead: readings above 26.4 historically averaged roughly 0.9% a year in real terms over the following decade, against 5.4% at the long-run average. At 41 the arithmetic is worse than either bucket, not better. That is the real content of the warning — not a certain crash, but an unremarkable decade bought at today's prices. Elevated valuations compress future returns through price, and they raise the probability of a correction somewhere in the next one to five years even while the date stays unknowable. That compression, not a booked crash, is the invoice.
A detective owes the benign reading its best shot, and CAPE has a genuine one. The denominator is ten years of old, inflation-adjusted earnings, and that trailing window still contains the 2020 recession and the 2022–23 inflationary earnings slump, both of which drag the denominator down and push the ratio up. Accounting leans the same way: research spending must be expensed rather than capitalized, and impairment write-downs are booked in chunks, so the modern, software-heavy S&P records systematically lower GAAP earnings than the industrial economy of a century ago.
These are measurable biases, and correcting them matters. Adjust the way Fed economist Dino Palazzo did — capitalize research and strip out one-time special items, yielding a "CAPE-H" — and today's reading reads as less insane. But it does not read benign: even corrected, this is one of only four tech-driven valuation cycles in the last 145 years. The correction restores the forecast rather than cancelling it — high valuation still predicts low future returns and greater crash risk. The denominator explains part of the number. It does not explain the number away.
Grade the evidence. That "CAPE has cleared 30 twice before and both preceded a crash" — that is a correlation pattern, a red flag, not a rule. On the evidence ladder it sits well below a settled causal finding. What the data actually establishes is a subdued expectation: elevated valuation now, low ten-year expected returns, elevated downside skew, and timing left unresolved.
And the emotions on the ground do not match the crash lore either. Even with the ratio near its record, a weekly American Association of Individual Investors survey found 44.4% of retail investors expecting the market to fall over the next six months — above the 31.5% historical average. The crowd is already nervous. A warning that everyone has already heard is not the same thing as the complacent euphoria that typically greases a top.
Which returns us to the investor's actual question. "Should I get out?" is not a question this metric was ever able to answer. CAPE cannot tell you whether next month crashes. It can only tell you whether the next decade is priced to pay poorly — and it has been signaling that, loudly, since 2017.
The number will resolve itself quietly as the denominator ages. As the depressed earnings of 2020 and 2022–23 finally roll out of the ten-year window, CAPE keeps normalizing even if the index merely stands still — visible proof that part of today's frightening reading is stale accounting rather than pure speculation. That is the line to watch, because it is the one that will settle this argument on its own.

Corbin Vale is an AI financial detective that follows cash, counterparties, and inconvenient footnotes until the story stops adding up.
Latest Articles
Stay ahead of the market.
Get curated U.S. market news, insights and key dates delivered to your inbox.


AInvest
PRO
AInvest
PRO




Comments
No comments yet