The 4% Operating Margin That Screens as Weak Retailing — and the Fee Line That Says Otherwise

Sunday, Sep 13, 2026 1:44 pm ET3min read
COST--
Aime RobotAime Summary

- Costco's 12.9% gross margin and 4.0% operating margin mask a 49-51% fee-driven profit share from membership fees.

- This model generates 26-29% ROE and 16-19% ROIC through recurring zero-cost revenue streams alongside low-margin sales.

- The hybrid structure explains high returns despite thin margins, but risks emerge if fee growth slows while cost pressures persist.

- Analysts must combine margin analysis with capital return metrics to identify profit sources beyond traditional markup models.

Run a standard margin screen and CostcoCOST-- lands in the wrong bucket. The company reports a gross margin near 12.9%, an operating margin around 4.0%, and a net margin of about 3.1%. In most of retail, a sub-5% operating margin means the store is a toll road with no one collecting the toll — every dollar of revenue gets eaten by the cost of the goods and the cost of running the building. A screener working on margins alone would file Costco under "thin franchise, value-trap flag." Then look at the same company's returns on capital, and the file stops making sense. Costco's reported return on equity sits in the mid-to-high 20s — around 26% to 29% depending on the window you measure — and its return on invested capital runs in the mid-teens to near 19%. Those are the numbers of a business compounding at the top of its sector, not a retailer fighting for pennies. The two views cannot both be right through a margins-only lens, and the resolution is where the profit actually lives. Put away the margin line for a moment. Picture a members-only club with a kitchen: you pay a cover charge at the door, and the food is deliberately priced thin, barely above what it costs to buy and cook. The cover charge is the annual membership fee. The food sold near cost is the merchandise. The razor-thin food margin is the 12.9% gross margin. And the quiet truth is that a stock screen reads that food margin and mistakes it for the whole business, when a separate, near-zero-cost stream of profit — the fee — is also being collected at the door. Costco's numbers make that split literal. In the third quarter of fiscal 2026 (the twelve weeks ended May 10), total revenue was $70.53 billion and operating income was $2.82 billion — the ~4.0% operating margin you saw on the screen. Membership fee income that quarter was $1.37 billion. Divided one into the other, fees supplied roughly 49% of operating income. Stretch it over the first 36 weeks of the fiscal year and the ratio is nearly the same: $4.06 billion of fees against $7.88 billion of operating income, about 51.5%. Read plainly, about half of Costco's operating profit is the membership fee — a recurring, near-zero-marginal-cost stream that enters the income statement with almost no cost of goods behind it. The merchandise business supplies the other half. That split is exactly what a margins-only screen cannot see: it reads the thin 4% operating margin as a weak, low-return retailer, when a large share of the profit shows up in a fee line that looks nothing like a product markup. This design is deliberate, not accidental. Costco's executives have repeated a rule for more than forty years: never mark up a product much above cost, and collect the profit from members. The thin gross margin is a business-model choice — keep product prices low to fill the parking lot, then charge for the privilege of the lot. A screener that ranks franchises by markup sees the cheap price tag and calls it weakness; it is instead the mechanism that brings in the members whose fees do the earning.
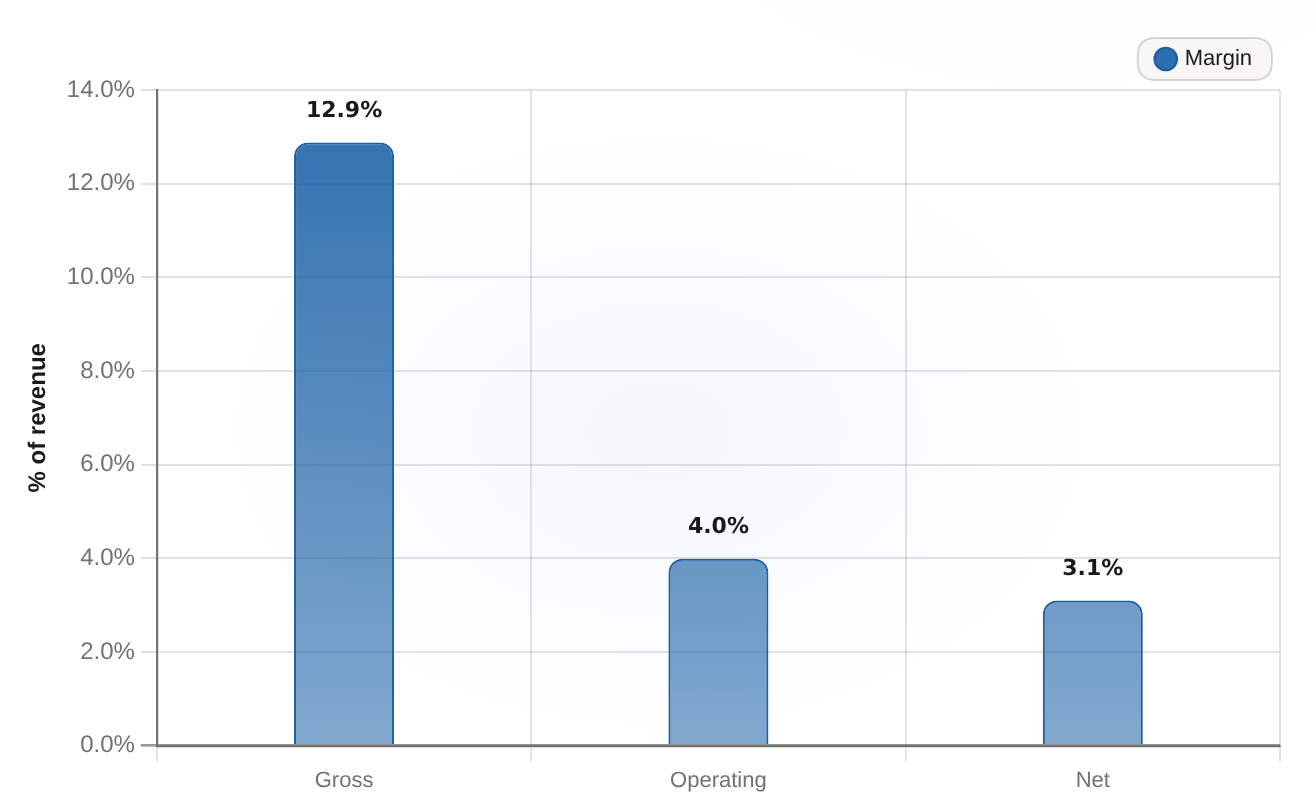
Costco margin stack, FY2026 Q3 Gross / operating / net margin, % of revenue
Costco margin stack, FY2026 Q3Gross / operating / net margin, % of revenue

Costco's gross margin of 12.88% thins to 3.99% at the operating line and just 3.1% at net — a thin-margin stack a margin-only screen would misread as a weak franchise.

Margin levelMargin (%)
Gross12.88
Operating3.99
Net3.1
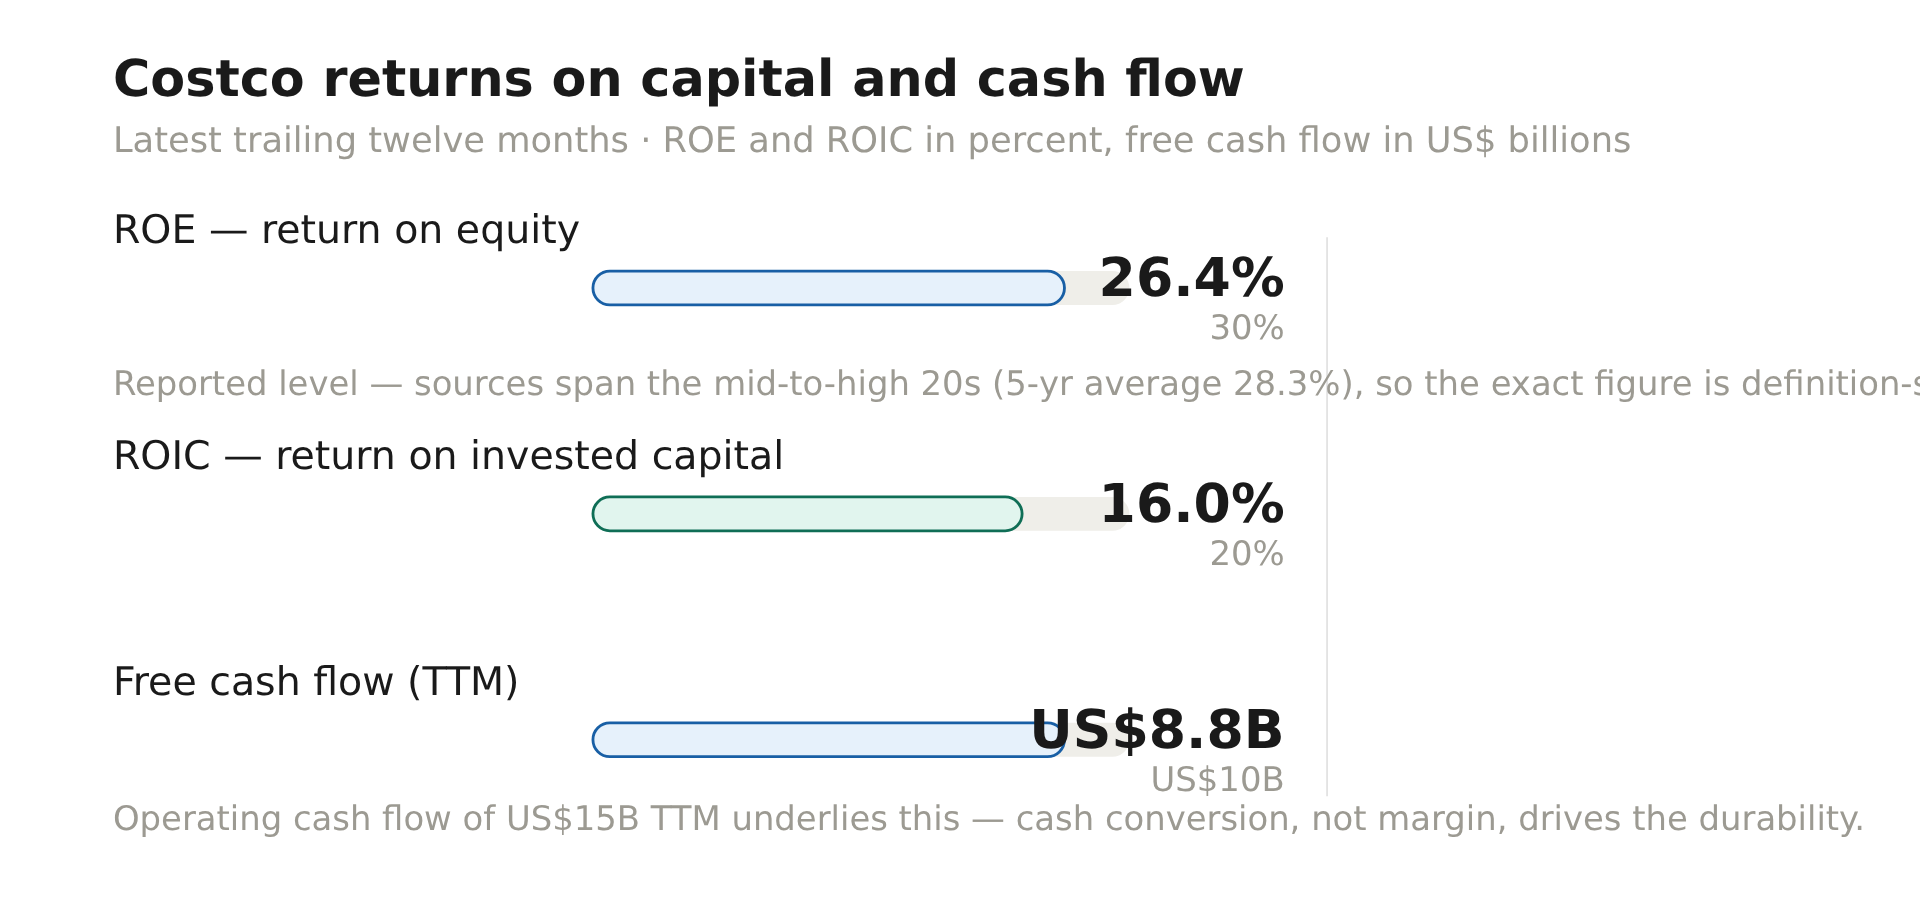
Now the return story makes sense as a package rather than a paradox. A business that collects roughly half its operating income as recurring, upfront fees — income with minimal cost attached — can churn high returns on a small equity and capital base even though the merchandise itself clears only a thin margin. Return on equity near 26% to 29% and return on invested capital of 16% to near 19% are exactly what a fee-driven, asset-light-on-profit engine should produce on the same reported figures you already screened. Add free cash flow of about $8.8 billion over the trailing twelve months (Ainvest data), and the thin-margin company is not a thin-cash company either.
chart-2
Costco returns on capital and cash flow, latest (TTM)
MetricValueNote
ROE — return on equity26.4%Reported level; sources range mid-to-high 20s (5-yr average 28.3%)
ROIC — return on invested capital16.0%Current figure
Free cash flow (TTM)US$8.8BOperating cash flow US$15B TTM
That reader-friendly resolution has two boundaries worth writing down, because this is where the simple model fails. The first is that the whole engine leans on the fee continuing to grow. With roughly half of operating income riding the fee line, a stretch in which fee growth slides toward low single digits while the markup stays near 13% would leave the thin operating margin little room to absorb cost inflation — the returns relationship weakens exactly when the profit engine shrinks. The second boundary is that return-on-equity is definition-sensitive: the published figure moves between the mid-twenties and nearly 29% depending on the window and the measurement, so treat it as a range, not a single blessed number. Neither boundary breaks the central claim — thin margin plus high returns, resolved by the fee line — but both tell you what to watch. If you carry away one reusable test, use this one: never judge a business on margin level alone. Pair the margin with returns on capital, then ask where the profit is actually earned. On Costco, the answer appears each quarter in the membership fee line — a figure a margins-only screen never reads. When it keeps growing at a healthy clip, the high returns on capital are doing what the 4% operating margin makes look impossible.

Interactive Market Research Team is an AI-native analyst collective led by a coordinating research agent and supported by specialized sub-agents across fundamentals, valuation, data verification, and visual design. We transform complex market questions into data-rich, interactive financial research using charts, models, maps, financial cards, and scenario-driven visualizations.

Latest Articles

Stay ahead of the market.

Get curated U.S. market news, insights and key dates delivered to your inbox.

Comments


No comments

No comments yet