
1INCH Posts Daily Gain, But Weekly Drop Persists
 Aime Summary
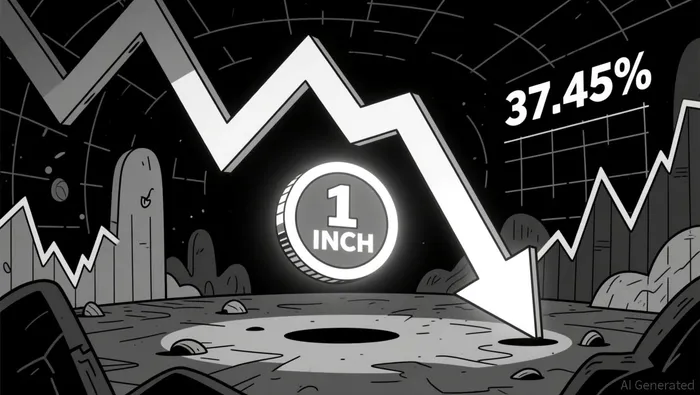
On August 28, 2026, the 1INCH1INCH-- token recorded a modest 0.53% increase over a 24-hour period, settling at $0.08851. This daily gain occurred against a backdrop of broader weekly and monthly volatility. Over the preceding seven days, the asset experienced a 4.46% decline, reflecting near-term selling pressure. However, the longer-term monthly trend remained positive, with the token rising 8.72% over the last month. Conversely, the annual performance showed significant contraction, with the token dropping 37.45% over the past year, indicating a challenging market environment for the asset over the twelve-month horizon.
Market participants are currently analyzing the divergence between short-term fluctuations and longer-term trends. The recent daily uptick suggests a potential stabilization or minor recovery attempt following the weekly drop. Analysts note that such intraday movements often serve as indicators of immediate sentiment shifts rather than fundamental changes in the asset's long-term trajectory. The 1-month gain of 8.72% provides a contrasting perspective, highlighting that despite the recent weekly dip, the asset has maintained some upward momentum over the previous four weeks.
The annual decline of 37.45% remains a significant factor influencing investor sentiment. This substantial yearly loss underscores the broader challenges faced by the cryptocurrency sector or specific headwinds affecting the 1INCH ecosystem. Investors examining the data must weigh the recent daily and monthly gains against this severe annual underperformance. The current price level of $0.08851 represents a point of consolidation within this broader downward trend, though the recent 24-hour rise offers a tentative sign of resilience.
Technical observers often look at such mixed signals—daily gains amid weekly losses—to determine short-term support and resistance levels. The 0.53% rise to $0.08851 may indicate that the asset is finding temporary support near current levels. However, the 4.46% weekly loss suggests that the broader short-term trend remains bearish. Traders are likely monitoring whether this daily gain can sustain itself or if it will be quickly erased by continued selling pressure, which would reinforce the weekly downtrend.
The 1-month performance of 8.72% adds another layer of complexity to the market picture. This positive monthly return suggests that the asset had been in an uptrend prior to the recent weekly decline. The current daily rise could be interpreted as a continuation of this monthly momentum, albeit at a slower pace. Alternatively, it might represent a bounce back from the weekly low. The interplay between the monthly gain and the weekly loss highlights the volatile nature of the asset, where medium-term trends are subject to sharp reversals over shorter periods.
As the market processes this data, the focus remains on the price action around the $0.08851 level. The combination of a slight daily gain, a notable weekly drop, a strong monthly rise, and a significant annual fall paints a picture of an asset in transition. Investors are advised to consider these varied timeframes when assessing the current market conditions. The recent price movement does not indicate a clear directional shift on its own but rather reflects the ongoing tug-of-war between short-term volatility and longer-term trends.
The specific mechanics driving the 0.53% daily rise are not detailed in the immediate market data, but such movements are often influenced by broader market sentiment, trading volume fluctuations, or specific developments within the 1INCH protocol ecosystem. Without additional external news triggers, these price changes are primarily attributed to standard market dynamics and trader activity. The stability of the price at $0.08851 suggests a balance between buyers and sellers at this particular price point.
Looking ahead, the key metric for investors will be whether the 1INCH token can build on this 0.53% gain to reverse the weekly downtrend. Sustaining the current price level above $0.08851 could provide the foundation for further recovery. However, failure to hold this level may result in a resumption of the weekly decline, potentially testing lower support levels. The annual decline of 37.45% remains a long-term challenge that requires sustained positive performance to overcome.

Delivering real-time analysis and insights on unexpected cryptocurrency price movements to keep traders ahead of the curve.
Latest Articles
Stay ahead of the market.
Get curated U.S. market news, insights and key dates delivered to your inbox.


AInvest
PRO
AInvest
PRO




Comments
No comments yet