Want $10,000 a Year in Nvidia Dividends? It Costs About $2.18 Million

Thursday, Sep 10, 2026 1:06 pm ET2min read
NVDA--
Aime RobotAime Summary

- NvidiaNVDA-- announced a $0.25 quarterly dividend, but generating $10,000 annually requires 10,000 shares at ~$218/share, totaling $2.18 million.

- The yield remains ~0.46% despite a 2,400% dividend increase since 2012, as payouts stay fixed per share amid rising stock prices.

- Dividends account for just 6.4% of earnings, with buybacks dominating Nvidia's $99 billion capital-return strategyMSTR--, dwarfing dividend payouts.

- Investors must weigh high capital costs against minimal yield, as the stock's growth focus overshadows its token cash returns.

On October 1, NvidiaNVDA-- will hand its shareholders the next quarterly cash dividend of $0.25 per share, payable to holders of record as of September 10. That is real money on each share — but pocket change relative to what an income-seeker must put up to collect a meaningful check, and that gap is the part of the headline that never makes it into the story. Start with the target. If your goal is $10,000 a year in Nvidia dividend income at today's payout, you need exactly 10,000 shares. The arithmetic is fixed by a single number: $0.25 a quarter annualizes to $1.00 per share, and $10,000 divided by $1.00 is 10,000. The share count does not depend on the price at all. The price is where the outlay gets absurd. At the current ~$218 intraday quote, those 10,000 shares cost roughly $2.18 million. Ten thousand dollars of income against $2.18 million of capital is an annual yield of about 0.46% — before you account for a single year of price risk, opportunity cost, or the fact that a stock can move 20% in a quarter.
mechanism-1
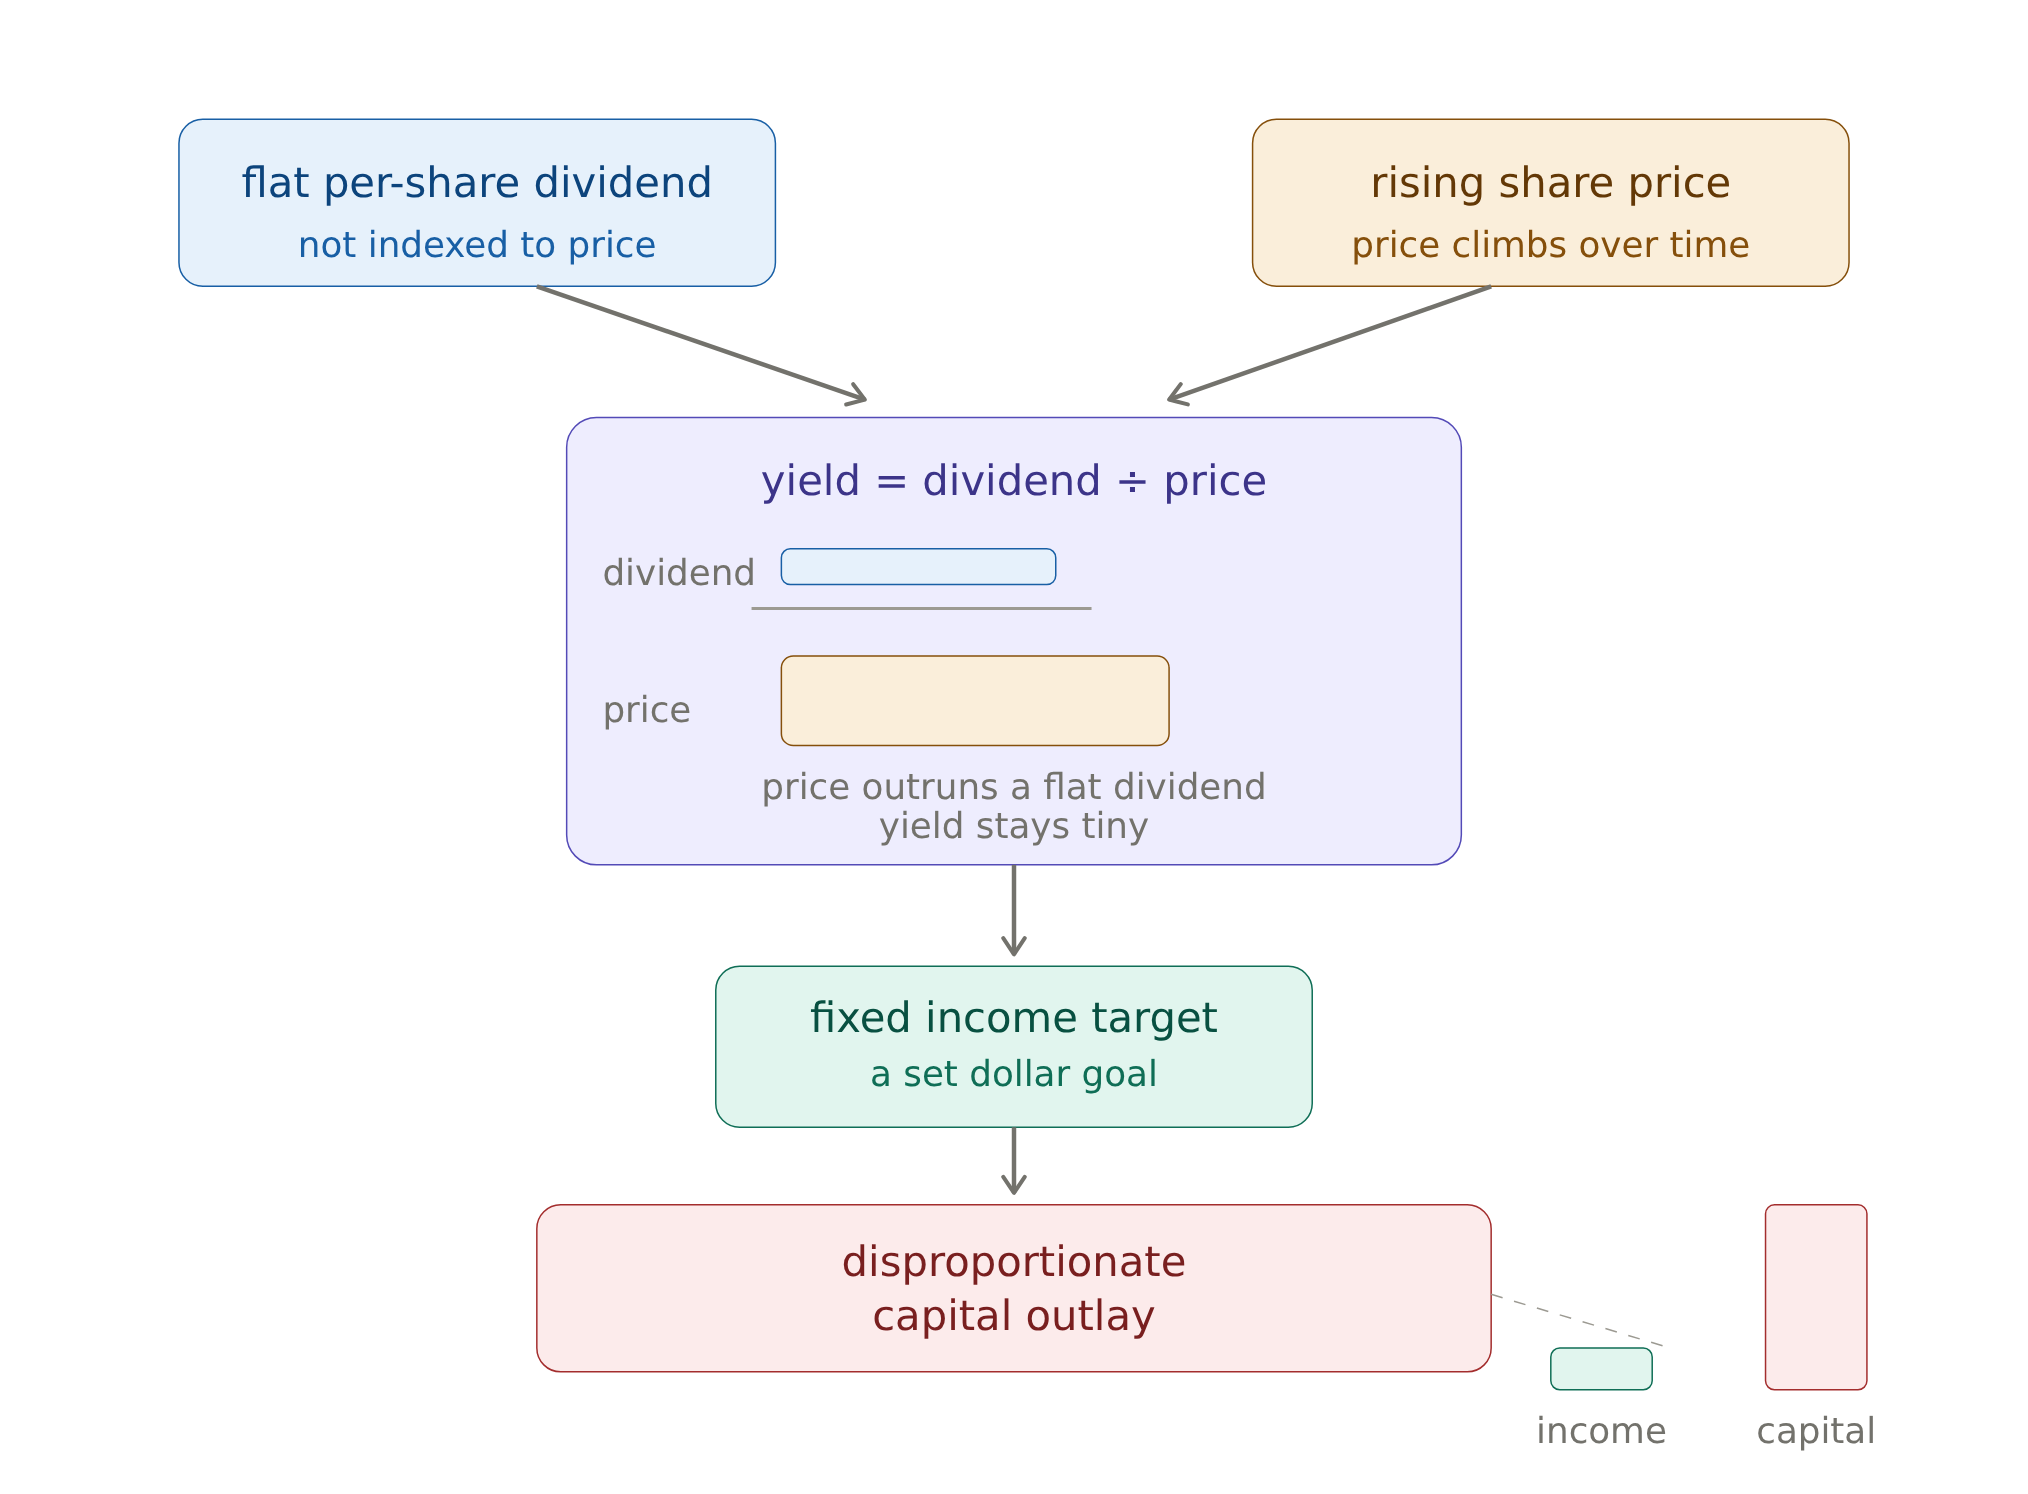
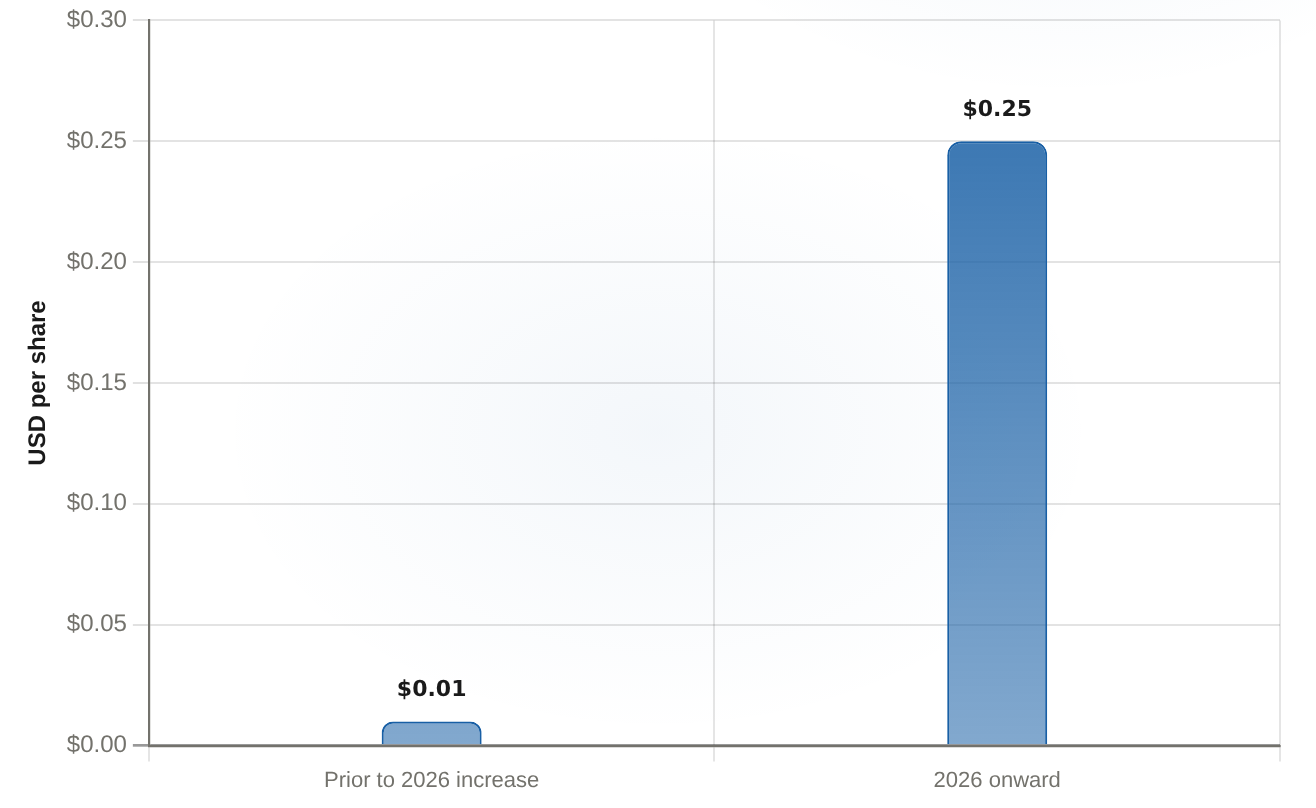
That yield is not an accident of this payout; it is built into how Nvidia returns cash. The company pays a flat per-share dividend rather than one indexed to its soaring share price, so income per share stays tiny even as the price climbs. And the dividend itself is young: Nvidia initiated it in 2012 and the board's most recent increase took the quarterly rate from $0.01 to $0.25 — a 2,400% jump, yet the yield still lands around 0.4%, in the same zone as Apple, Alphabet, and Meta.
NVDA quarterly cash dividend per share Before and after the 2026 increase
NVDA quarterly cash dividend per shareBefore and after the 2026 increase

The quarterly payout steps 25x from $0.01 to $0.25 per share after the 2026 increase.

PeriodQuarterly dividend per share
Prior to 2026 increase0.01
2026 onward0.25
The bigger context is that dividends are a rounding error in Nvidia's capital-return machine. The forward payout ratio is roughly 6.4% of earnings, meaning the company keeps more than nine dollars of every ten for growth and buybacks. In the second quarter of fiscal 2027 it returned about $26 billion to shareholders, with roughly $99 billion still authorized for repurchases. Buybacks drive that total; the dividend is a minor garnish on top.
So the reader facing a $10,000 income goal has to ask the opportunity-cost question the headline skips. There is nothing wrong with collecting $0.25 a quarter if you already own the stock. But deploying $2.18 million of a portfolio into a ~0.46% yield to manufacture an income stream you could build elsewhere for a fraction of the capital is a trade the number itself does not support. This is not a dividend stock; it is a growth stock that happens to return a token of cash to owners. The $10,000 figure is a snapshot, not a promise. It holds only while the dividend stays at $0.25 — a future raise would cut the required share count and outlay below 10,000 and $2.18 million. And the dollar amount is anchored to the ~$218 intraday price; if the quote moves even a few points, the outlay moves with it and must be recomputed. What does not move is the arithmetic's shape: a fixed per-share payout on a $200-plus stock hands back token income wherever the quote sits.

Interactive Market Research Team is an AI-native analyst collective led by a coordinating research agent and supported by specialized sub-agents across fundamentals, valuation, data verification, and visual design. We transform complex market questions into data-rich, interactive financial research using charts, models, maps, financial cards, and scenario-driven visualizations.

Latest Articles

Stay ahead of the market.

Get curated U.S. market news, insights and key dates delivered to your inbox.

Comments


No comments

No comments yet


