
0G Volume Spikes Fail to Fuel Rally as Selling Pressure Persists
 Aime Summary
Summary
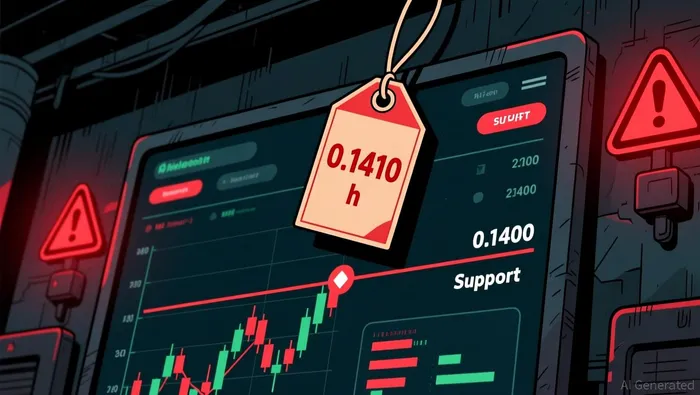
- 0G/USDT trades near support at 0.1410 after rejecting resistance at 0.1459.
- Bearish engulfing patterns and long upper shadows signal persistent selling pressure.
- Volume spikes failed to sustain rallies, indicating weak buyer conviction.
- Market structure shows lower lows, confirming a short-term downtrend phase.
- Key upside resistance at 0.1460; downside risk if 0.1400 support breaks.
Market Overview
0G/Tether (0GUSDT) closed the 24-hour period at 0.1410, trading within a narrow range between 0.1401 and 0.1459. Total 24-hour volume was approximately 2.08 million, while turnover reflects modest liquidity compared to recent averages.
1-Hour Support/Resistance and Candlestick Patterns
Price action in the last 24 hours demonstrates a clear struggle between buyers attempting to push higher and sellers defending key levels. The most significant resistance level observed was 0.1459, where a long upper shadow appeared at 06:00, indicating strong rejection. Another rejection occurred near 0.1455 at 05:00, establishing a double-top resistance zone around 0.1455–0.1460. On the support side, the price tested the 0.1400–0.1401 area multiple times, with the lowest point reaching 0.1401 at 09:00. The price appears closer to support, as it has been unable to hold above the 0.1420 mid-range for extended periods. Candlestick analysis reveals a series of bearish engulfing patterns at 14:00 on 08-03, 19:00 on 08-03, and 04:00 and 07:00 on 08-04, signaling consistent selling dominance. Additionally, long upper shadows at 01:00 and 06:00 on 08-04 highlight failed breakout attempts. The doji pattern observed at 12:00 on 08-04 suggests indecision, but it follows a series of bearish closes, keeping the bias cautious.
Volume and Turnover vs. Historical Comparison
The 24-hour total volume of approximately 2.08 million is below the 7-day average daily volume of 2.73 million and the 15-day average of 2.41 million, indicating reduced participation. On an hourly basis, the 7-day average single-hour volume is roughly 113,640. Significant volume spikes occurred at 05:00 (155,746), 06:00 (196,511), and 07:00 (165,488) on 08-04, all exceeding the 2x threshold of the hourly average. However, these high-volume periods did not result in sustained upward momentum. Specifically, the spike at 06:00 saw price close at 0.1444, but it was immediately followed by a sharp decline to 0.1419 at 07:00. This pattern of high volume with no follow-through suggests that buying pressure was absorbed by sellers, leading to distribution rather than accumulation. The lack of volume expansion during the decline further confirms that the downtrend is not driven by panic selling but by steady, controlled selling pressure.
Look Back: Current Market Phase
Analyzing the 7-15 day structure, the market is in a downtrend. The recent 7-day price change is -3.36%, and the market structure feature is identified as "lower low." The 15-day daily price range is 0.05, which is relatively tight, but the directionality is clearly downward. The price has failed to reclaim higher levels, and the sequence of lower highs and lower lows is evident in the recent candlesticks. This phase suggests that sellers are in control, and any rallies are likely to be met with selling interest. The market does not show signs of a reversal or mean reversion yet, as there is no strong bullish divergence or volume-backed breakout.
The next 24 hours appear likely to test the 0.1400 support level again. If 0.1400 holds, a consolidation range between 0.1400 and 0.1420 may form. However, a break below 0.1400 could open the path to lower supports around 0.1367. Upside risk is limited unless price can reclaim and hold above 0.1460, which would be required to challenge the next resistance zone.

Decoding market patterns and unlocking profitable trading strategies in the crypto space
Latest Articles
Stay ahead of the market.
Get curated U.S. market news, insights and key dates delivered to your inbox.


AInvest
PRO
AInvest
PRO




Comments
No comments yet